Zip Codes with the Highest Percentage of Population Employed in Installation, Maintenance & Repair in Homosassa, FL
RELATED REPORTS & OPTIONS
Installation, Maintenance & Repair
Homosassa
Compare Zip Codes
Map of Zip Codes with the Highest Percentage of Population Employed in Installation, Maintenance & Repair in Homosassa
0.0%
6.0%
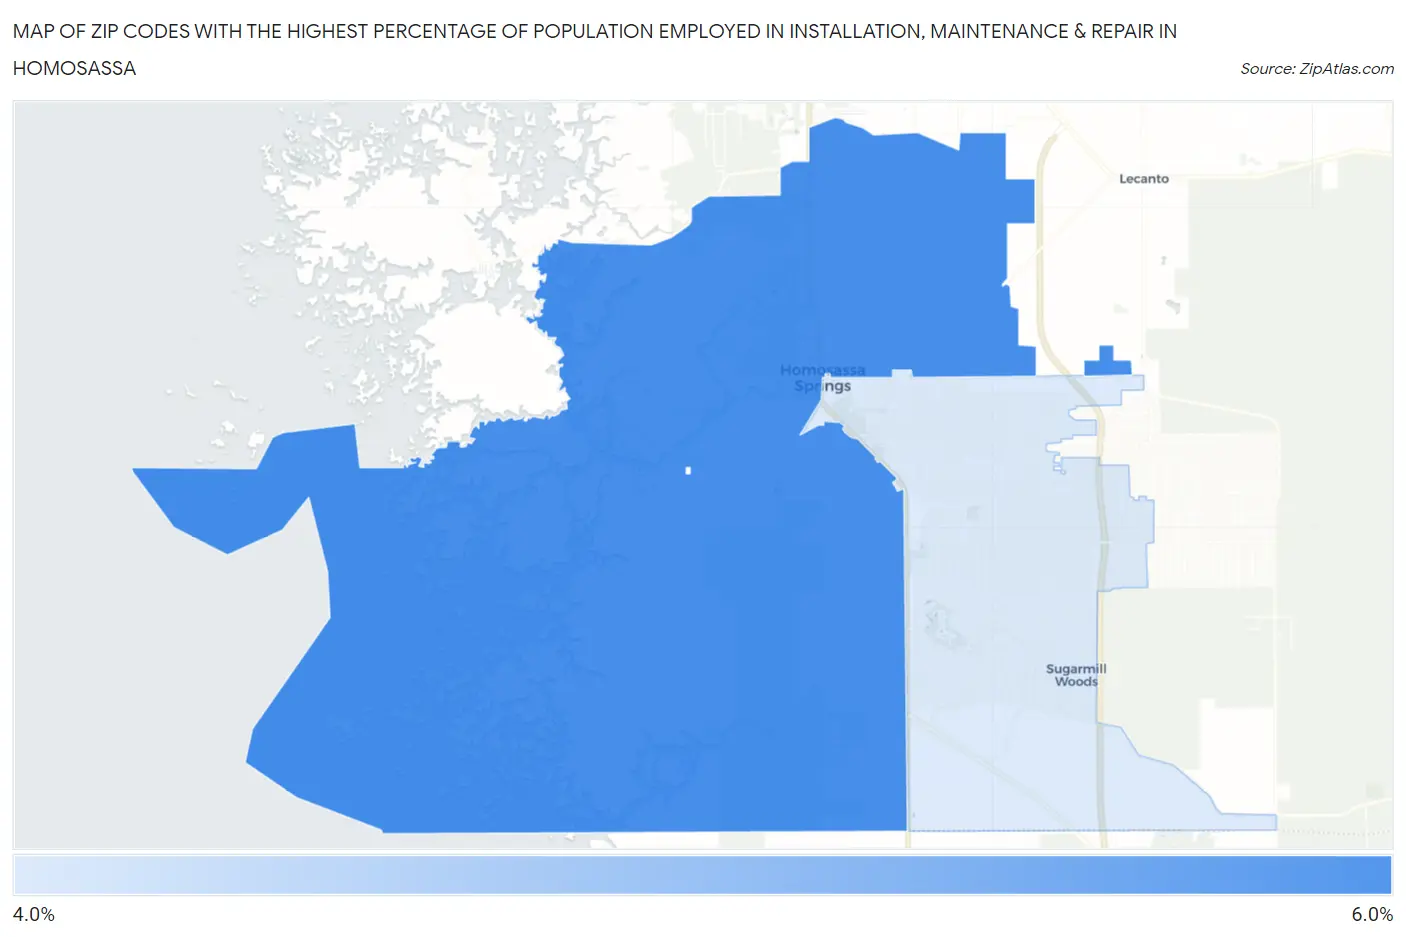
Zip Codes with the Highest Percentage of Population Employed in Installation, Maintenance & Repair in Homosassa, FL
| Zip Code | % Employed | vs State | vs National | |
| 1. | 34448 | 5.4% | 3.3%(+2.12)#130 | 3.1%(+2.34)#7,510 |
| 2. | 34446 | 4.6% | 3.3%(+1.28)#220 | 3.1%(+1.49)#10,189 |
1
Common Questions
What are the Top Zip Codes with the Highest Percentage of Population Employed in Installation, Maintenance & Repair in Homosassa, FL?
Top Zip Codes with the Highest Percentage of Population Employed in Installation, Maintenance & Repair in Homosassa, FL are:
What zip code has the Highest Percentage of Population Employed in Installation, Maintenance & Repair in Homosassa, FL?
34448 has the Highest Percentage of Population Employed in Installation, Maintenance & Repair in Homosassa, FL with 5.4%.
What is the Percentage of Population Employed in Installation, Maintenance & Repair in Homosassa, FL?
Percentage of Population Employed in Installation, Maintenance & Repair in Homosassa is 7.9%.
What is the Percentage of Population Employed in Installation, Maintenance & Repair in Florida?
Percentage of Population Employed in Installation, Maintenance & Repair in Florida is 3.3%.
What is the Percentage of Population Employed in Installation, Maintenance & Repair in the United States?
Percentage of Population Employed in Installation, Maintenance & Repair in the United States is 3.1%.