Zip Codes with the Highest Percentage of Population Employed in Security & Protection in Bonita Springs, FL
RELATED REPORTS & OPTIONS
Security & Protection
Bonita Springs
Compare Zip Codes
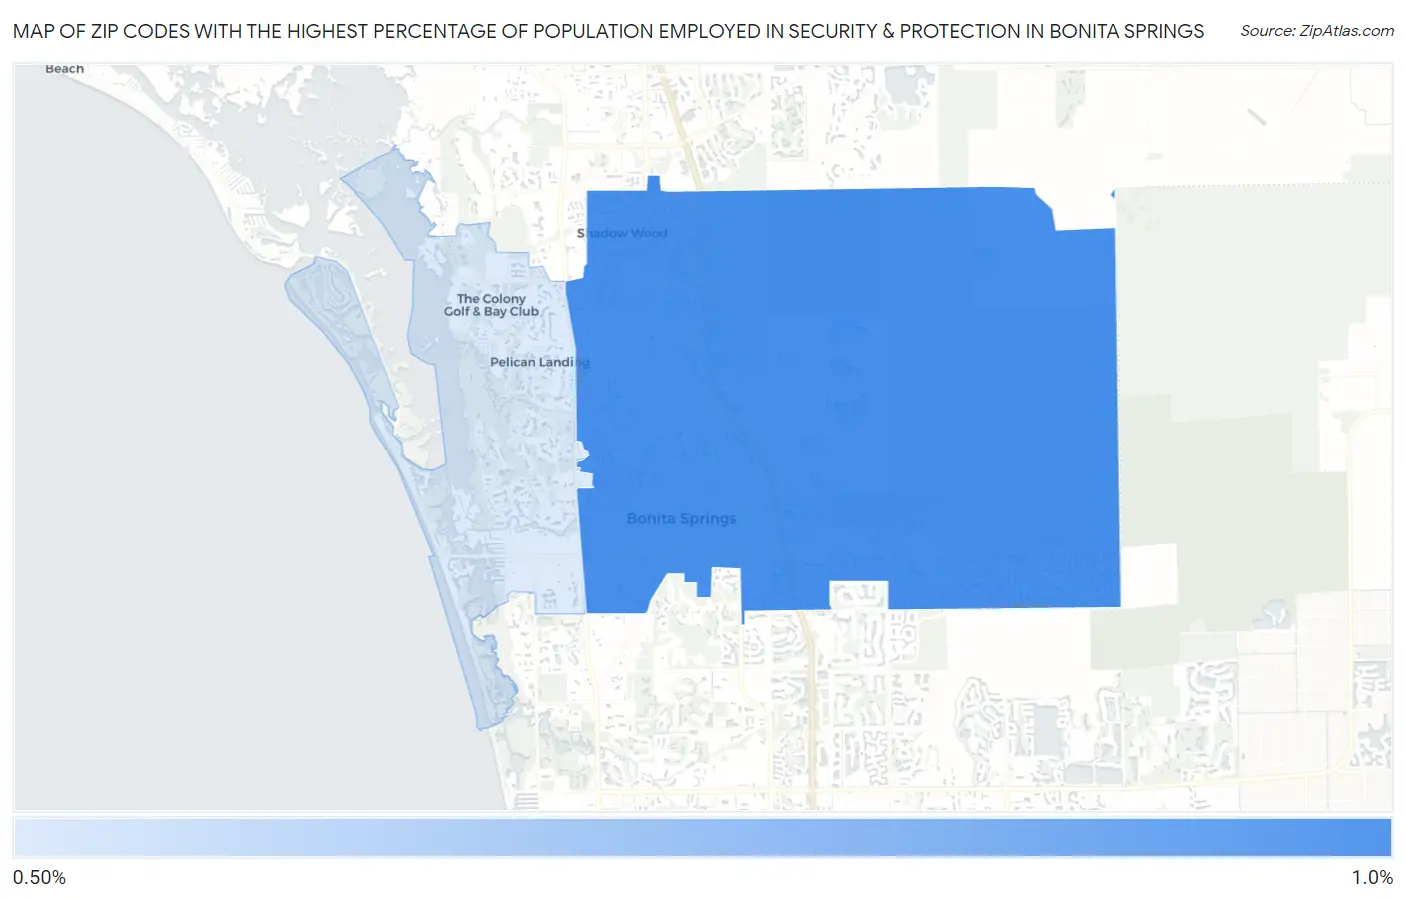
Map of Zip Codes with the Highest Percentage of Population Employed in Security & Protection in Bonita Springs
0.0%
1.0%
Zip Codes with the Highest Percentage of Population Employed in Security & Protection in Bonita Springs, FL
| Zip Code | % Employed | vs State | vs National | |
| 1. | 34135 | 0.86% | 2.4%(-1.56)#828 | 2.1%(-1.29)#21,028 |
| 2. | 34134 | 0.58% | 2.4%(-1.84)#868 | 2.1%(-1.57)#22,788 |
1
Common Questions
What are the Top Zip Codes with the Highest Percentage of Population Employed in Security & Protection in Bonita Springs, FL?
Top Zip Codes with the Highest Percentage of Population Employed in Security & Protection in Bonita Springs, FL are:
What zip code has the Highest Percentage of Population Employed in Security & Protection in Bonita Springs, FL?
34135 has the Highest Percentage of Population Employed in Security & Protection in Bonita Springs, FL with 0.86%.
What is the Percentage of Population Employed in Security & Protection in Bonita Springs, FL?
Percentage of Population Employed in Security & Protection in Bonita Springs is 0.79%.
What is the Percentage of Population Employed in Security & Protection in Florida?
Percentage of Population Employed in Security & Protection in Florida is 2.4%.
What is the Percentage of Population Employed in Security & Protection in the United States?
Percentage of Population Employed in Security & Protection in the United States is 2.1%.