Zip Codes with the Highest Percentage of Hawaiian / Pacific Population in Bonita Springs, FL
RELATED REPORTS & OPTIONS
Hawaiian / Pacific
Bonita Springs
Compare Zip Codes
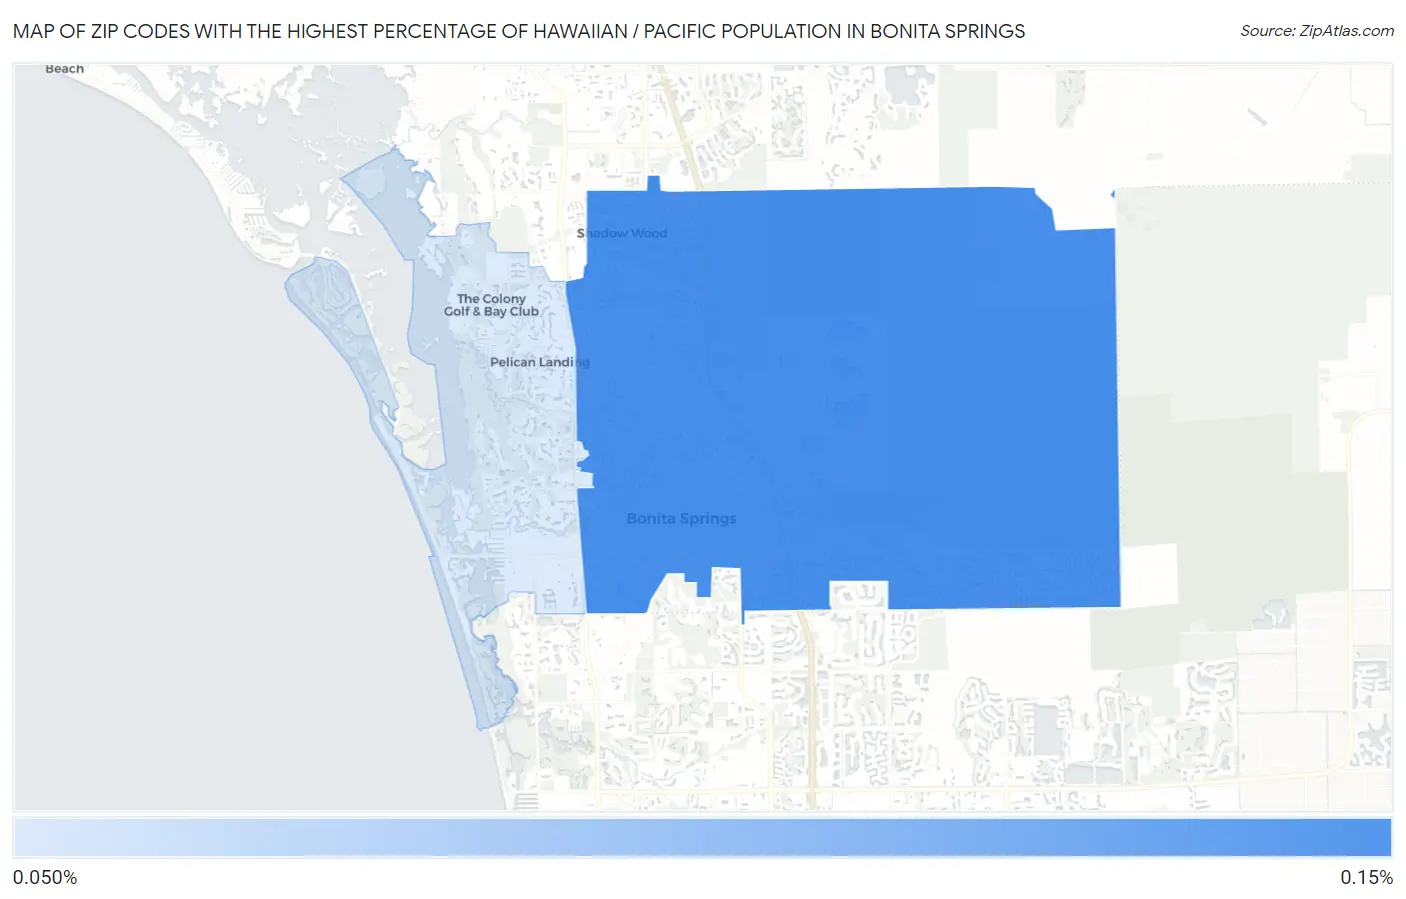
Map of Zip Codes with the Highest Percentage of Hawaiian / Pacific Population in Bonita Springs
0.0%
0.15%
Zip Codes with the Highest Percentage of Hawaiian / Pacific Population in Bonita Springs, FL
| Zip Code | Hawaiian / Pacific | vs State | vs National | |
| 1. | 34135 | 0.14% | 0.061%(+0.079)#108 | 0.19%(-0.049)#3,468 |
| 2. | 34134 | 0.069% | 0.061%(+0.008)#186 | 0.19%(-0.119)#4,647 |
1
Common Questions
What are the Top Zip Codes with the Highest Percentage of Hawaiian / Pacific Population in Bonita Springs, FL?
Top Zip Codes with the Highest Percentage of Hawaiian / Pacific Population in Bonita Springs, FL are:
What zip code has the Highest Percentage of Hawaiian / Pacific Population in Bonita Springs, FL?
34135 has the Highest Percentage of Hawaiian / Pacific Population in Bonita Springs, FL with 0.14%.
What is the Percentage of Hawaiian / Pacific Population in Bonita Springs, FL?
Percentage of Hawaiian / Pacific Population in Bonita Springs is 0.14%.
What is the Percentage of Hawaiian / Pacific Population in Florida?
Percentage of Hawaiian / Pacific Population in Florida is 0.061%.
What is the Percentage of Hawaiian / Pacific Population in the United States?
Percentage of Hawaiian / Pacific Population in the United States is 0.19%.