Zip Codes with the Highest Percentage of Population Employed in Security & Protection in Marianna, FL
RELATED REPORTS & OPTIONS
Security & Protection
Marianna
Compare Zip Codes
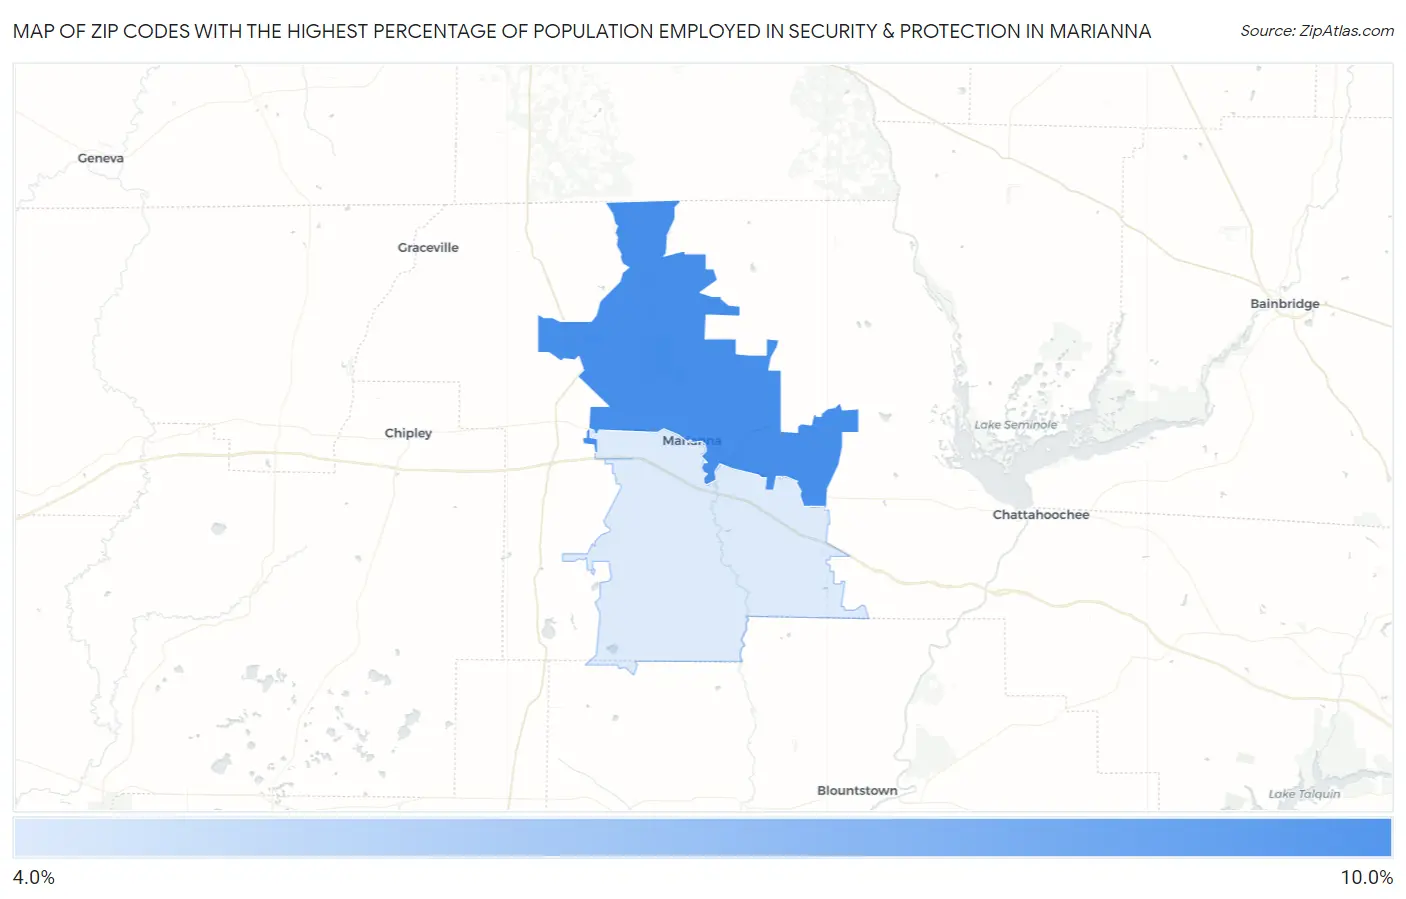
Map of Zip Codes with the Highest Percentage of Population Employed in Security & Protection in Marianna
0.0%
10.0%
Zip Codes with the Highest Percentage of Population Employed in Security & Protection in Marianna, FL
| Zip Code | % Employed | vs State | vs National | |
| 1. | 32446 | 8.1% | 2.4%(+5.67)#31 | 2.1%(+5.95)#1,133 |
| 2. | 32448 | 4.1% | 2.4%(+1.64)#155 | 2.1%(+1.91)#4,371 |
1
Common Questions
What are the Top Zip Codes with the Highest Percentage of Population Employed in Security & Protection in Marianna, FL?
Top Zip Codes with the Highest Percentage of Population Employed in Security & Protection in Marianna, FL are:
What zip code has the Highest Percentage of Population Employed in Security & Protection in Marianna, FL?
32446 has the Highest Percentage of Population Employed in Security & Protection in Marianna, FL with 8.1%.
What is the Percentage of Population Employed in Security & Protection in Marianna, FL?
Percentage of Population Employed in Security & Protection in Marianna is 2.8%.
What is the Percentage of Population Employed in Security & Protection in Florida?
Percentage of Population Employed in Security & Protection in Florida is 2.4%.
What is the Percentage of Population Employed in Security & Protection in the United States?
Percentage of Population Employed in Security & Protection in the United States is 2.1%.