Zimbabwean vs Spanish American Indian Births to Unmarried Women
COMPARE
Zimbabwean
Spanish American Indian
Births to Unmarried Women
Births to Unmarried Women Comparison
Zimbabweans
Spanish American Indians
28.7%
BIRTHS TO UNMARRIED WOMEN
98.2/ 100
METRIC RATING
78th/ 347
METRIC RANK
37.4%
BIRTHS TO UNMARRIED WOMEN
0.0/ 100
METRIC RATING
283rd/ 347
METRIC RANK
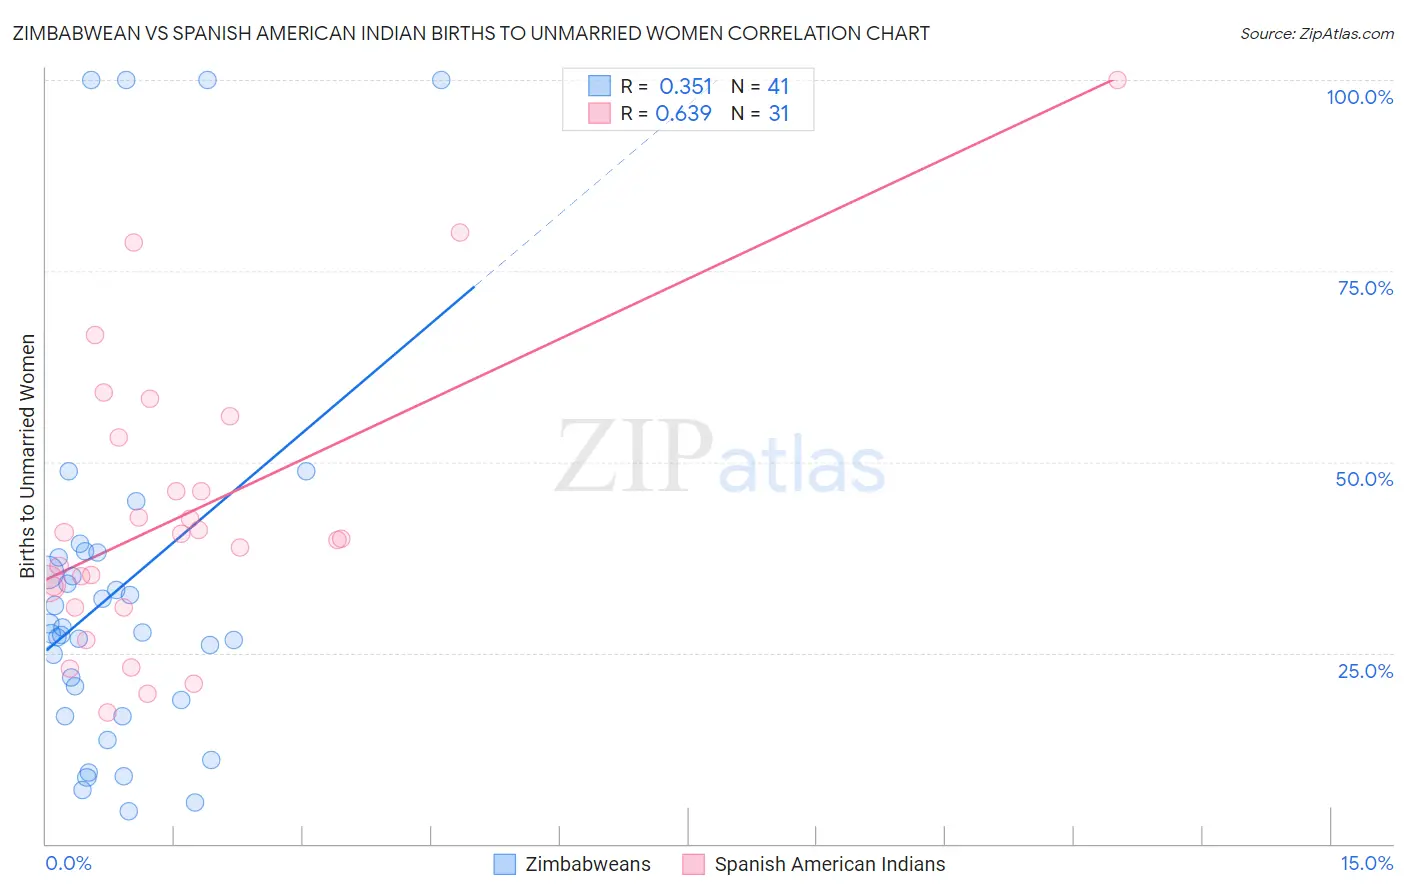
Zimbabwean vs Spanish American Indian Births to Unmarried Women Correlation Chart
The statistical analysis conducted on geographies consisting of 68,374,099 people shows a mild positive correlation between the proportion of Zimbabweans and percentage of births to unmarried women in the United States with a correlation coefficient (R) of 0.351 and weighted average of 28.7%. Similarly, the statistical analysis conducted on geographies consisting of 72,423,979 people shows a significant positive correlation between the proportion of Spanish American Indians and percentage of births to unmarried women in the United States with a correlation coefficient (R) of 0.639 and weighted average of 37.4%, a difference of 30.4%.
Births to Unmarried Women Correlation Summary
| Measurement | Zimbabwean | Spanish American Indian |
| Minimum | 4.3% | 17.2% |
| Maximum | 100.0% | 100.0% |
| Range | 95.7% | 82.8% |
| Mean | 33.3% | 43.1% |
| Median | 27.6% | 40.0% |
| Interquartile 25% (IQ1) | 17.8% | 31.0% |
| Interquartile 75% (IQ3) | 37.9% | 53.2% |
| Interquartile Range (IQR) | 20.1% | 22.2% |
| Standard Deviation (Sample) | 25.0% | 18.9% |
| Standard Deviation (Population) | 24.7% | 18.6% |
Similar Demographics by Births to Unmarried Women
Demographics Similar to Zimbabweans by Births to Unmarried Women
In terms of births to unmarried women, the demographic groups most similar to Zimbabweans are Danish (28.7%, a difference of 0.020%), Immigrants from Afghanistan (28.7%, a difference of 0.050%), Immigrants from Austria (28.7%, a difference of 0.090%), Immigrants from Northern Europe (28.6%, a difference of 0.16%), and Romanian (28.7%, a difference of 0.20%).
| Demographics | Rating | Rank | Births to Unmarried Women |
| Jordanians | 98.5 /100 | #71 | Exceptional 28.5% |
| Immigrants | Sweden | 98.5 /100 | #72 | Exceptional 28.5% |
| Albanians | 98.5 /100 | #73 | Exceptional 28.5% |
| Immigrants | Bolivia | 98.5 /100 | #74 | Exceptional 28.6% |
| Immigrants | Switzerland | 98.4 /100 | #75 | Exceptional 28.6% |
| Israelis | 98.4 /100 | #76 | Exceptional 28.6% |
| Immigrants | Northern Europe | 98.3 /100 | #77 | Exceptional 28.6% |
| Zimbabweans | 98.2 /100 | #78 | Exceptional 28.7% |
| Danes | 98.2 /100 | #79 | Exceptional 28.7% |
| Immigrants | Afghanistan | 98.1 /100 | #80 | Exceptional 28.7% |
| Immigrants | Austria | 98.1 /100 | #81 | Exceptional 28.7% |
| Romanians | 98.0 /100 | #82 | Exceptional 28.7% |
| Immigrants | Kuwait | 98.0 /100 | #83 | Exceptional 28.8% |
| Immigrants | Poland | 97.6 /100 | #84 | Exceptional 28.9% |
| Sri Lankans | 97.5 /100 | #85 | Exceptional 28.9% |
Demographics Similar to Spanish American Indians by Births to Unmarried Women
In terms of births to unmarried women, the demographic groups most similar to Spanish American Indians are Immigrants from Central America (37.4%, a difference of 0.060%), Liberian (37.4%, a difference of 0.080%), Immigrants from Mexico (37.5%, a difference of 0.16%), Immigrants from Guatemala (37.5%, a difference of 0.18%), and Immigrants from Belize (37.3%, a difference of 0.25%).
| Demographics | Rating | Rank | Births to Unmarried Women |
| Belizeans | 0.1 /100 | #276 | Tragic 37.0% |
| Guatemalans | 0.1 /100 | #277 | Tragic 37.1% |
| Immigrants | Latin America | 0.1 /100 | #278 | Tragic 37.1% |
| West Indians | 0.1 /100 | #279 | Tragic 37.3% |
| Immigrants | St. Vincent and the Grenadines | 0.1 /100 | #280 | Tragic 37.3% |
| Immigrants | Belize | 0.1 /100 | #281 | Tragic 37.3% |
| Liberians | 0.0 /100 | #282 | Tragic 37.4% |
| Spanish American Indians | 0.0 /100 | #283 | Tragic 37.4% |
| Immigrants | Central America | 0.0 /100 | #284 | Tragic 37.4% |
| Immigrants | Mexico | 0.0 /100 | #285 | Tragic 37.5% |
| Immigrants | Guatemala | 0.0 /100 | #286 | Tragic 37.5% |
| Creek | 0.0 /100 | #287 | Tragic 37.6% |
| Immigrants | Liberia | 0.0 /100 | #288 | Tragic 37.6% |
| Alaskan Athabascans | 0.0 /100 | #289 | Tragic 37.7% |
| Hispanics or Latinos | 0.0 /100 | #290 | Tragic 37.8% |