West Indian vs Immigrants from Greece Family Households
COMPARE
West Indian
Immigrants from Greece
Family Households
Family Households Comparison
West Indians
Immigrants from Greece
63.1%
FAMILY HOUSEHOLDS
0.3/ 100
METRIC RATING
275th/ 347
METRIC RANK
63.5%
FAMILY HOUSEHOLDS
2.9/ 100
METRIC RATING
231st/ 347
METRIC RANK
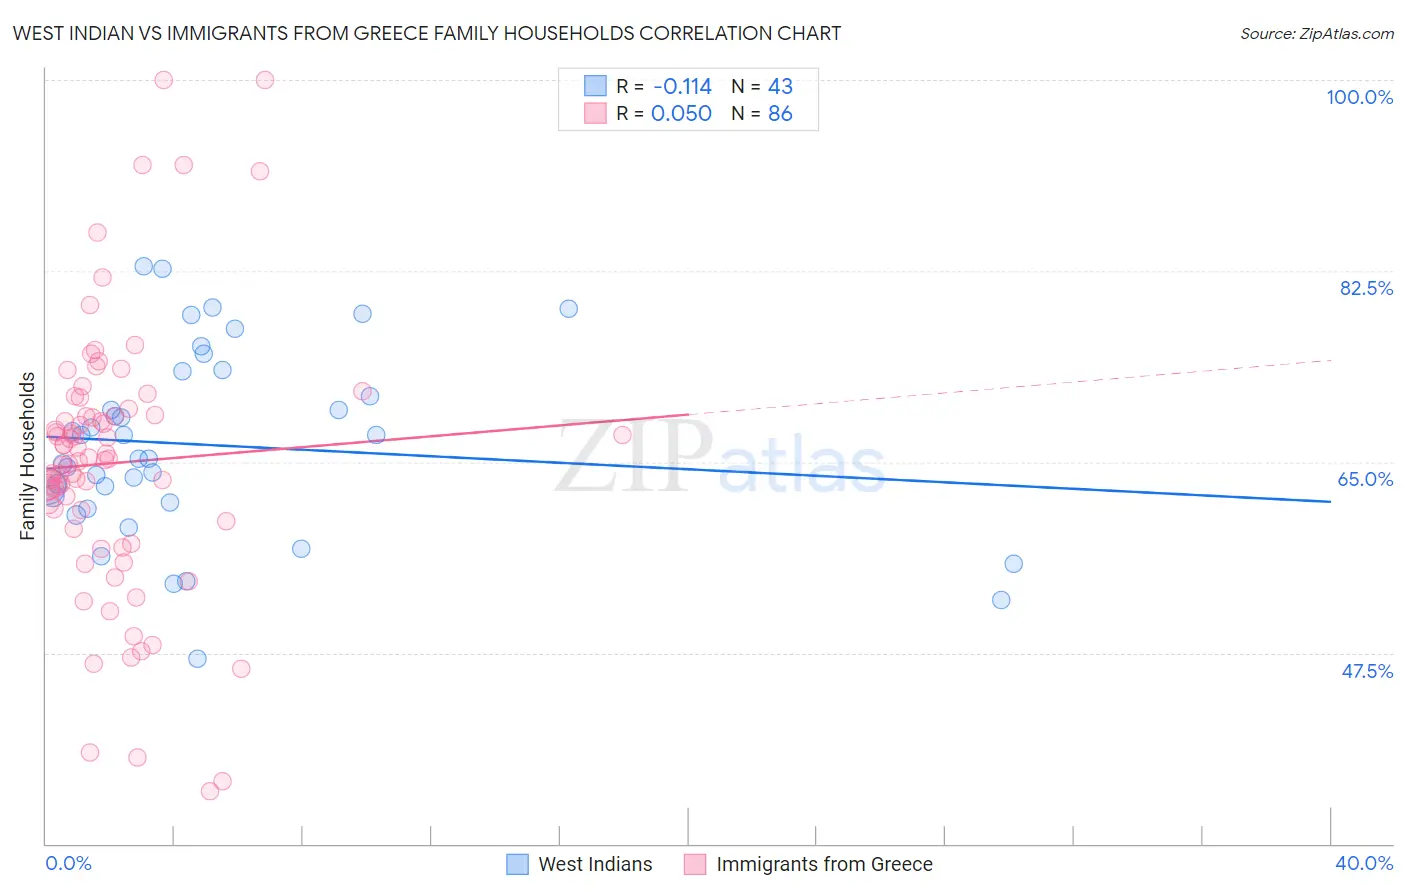
West Indian vs Immigrants from Greece Family Households Correlation Chart
The statistical analysis conducted on geographies consisting of 253,859,677 people shows a poor negative correlation between the proportion of West Indians and percentage of family households in the United States with a correlation coefficient (R) of -0.114 and weighted average of 63.1%. Similarly, the statistical analysis conducted on geographies consisting of 216,856,850 people shows no correlation between the proportion of Immigrants from Greece and percentage of family households in the United States with a correlation coefficient (R) of 0.050 and weighted average of 63.5%, a difference of 0.77%.
Family Households Correlation Summary
| Measurement | West Indian | Immigrants from Greece |
| Minimum | 47.0% | 34.8% |
| Maximum | 83.0% | 100.0% |
| Range | 36.0% | 65.2% |
| Mean | 66.5% | 64.9% |
| Median | 65.3% | 65.2% |
| Interquartile 25% (IQ1) | 61.3% | 59.6% |
| Interquartile 75% (IQ3) | 73.3% | 69.3% |
| Interquartile Range (IQR) | 12.0% | 9.7% |
| Standard Deviation (Sample) | 8.5% | 12.3% |
| Standard Deviation (Population) | 8.4% | 12.3% |
Similar Demographics by Family Households
Demographics Similar to West Indians by Family Households
In terms of family households, the demographic groups most similar to West Indians are Lumbee (63.1%, a difference of 0.0%), Immigrants from Kazakhstan (63.1%, a difference of 0.010%), Serbian (63.0%, a difference of 0.010%), Immigrants from Croatia (63.1%, a difference of 0.020%), and Immigrants from Turkey (63.1%, a difference of 0.020%).
| Demographics | Rating | Rank | Family Households |
| Immigrants | Singapore | 0.4 /100 | #268 | Tragic 63.1% |
| Yugoslavians | 0.4 /100 | #269 | Tragic 63.1% |
| Immigrants | Austria | 0.3 /100 | #270 | Tragic 63.1% |
| Immigrants | Croatia | 0.3 /100 | #271 | Tragic 63.1% |
| Immigrants | Turkey | 0.3 /100 | #272 | Tragic 63.1% |
| Immigrants | Kazakhstan | 0.3 /100 | #273 | Tragic 63.1% |
| Lumbee | 0.3 /100 | #274 | Tragic 63.1% |
| West Indians | 0.3 /100 | #275 | Tragic 63.1% |
| Serbians | 0.3 /100 | #276 | Tragic 63.0% |
| Ottawa | 0.3 /100 | #277 | Tragic 63.0% |
| Immigrants | Belgium | 0.2 /100 | #278 | Tragic 63.0% |
| Immigrants | Yemen | 0.2 /100 | #279 | Tragic 63.0% |
| Immigrants | Bulgaria | 0.2 /100 | #280 | Tragic 63.0% |
| Estonians | 0.2 /100 | #281 | Tragic 62.9% |
| New Zealanders | 0.1 /100 | #282 | Tragic 62.9% |
Demographics Similar to Immigrants from Greece by Family Households
In terms of family households, the demographic groups most similar to Immigrants from Greece are Immigrants from Brazil (63.6%, a difference of 0.020%), Immigrants from Northern Africa (63.5%, a difference of 0.030%), Immigrants from Armenia (63.5%, a difference of 0.050%), Bulgarian (63.6%, a difference of 0.060%), and Blackfeet (63.6%, a difference of 0.070%).
| Demographics | Rating | Rank | Family Households |
| Turks | 4.5 /100 | #224 | Tragic 63.6% |
| Immigrants | Hungary | 4.3 /100 | #225 | Tragic 63.6% |
| Immigrants | Bahamas | 4.2 /100 | #226 | Tragic 63.6% |
| Trinidadians and Tobagonians | 4.1 /100 | #227 | Tragic 63.6% |
| Blackfeet | 3.6 /100 | #228 | Tragic 63.6% |
| Bulgarians | 3.4 /100 | #229 | Tragic 63.6% |
| Immigrants | Brazil | 3.0 /100 | #230 | Tragic 63.6% |
| Immigrants | Greece | 2.9 /100 | #231 | Tragic 63.5% |
| Immigrants | Northern Africa | 2.6 /100 | #232 | Tragic 63.5% |
| Immigrants | Armenia | 2.6 /100 | #233 | Tragic 63.5% |
| Finns | 2.3 /100 | #234 | Tragic 63.5% |
| Albanians | 2.2 /100 | #235 | Tragic 63.5% |
| Ghanaians | 2.1 /100 | #236 | Tragic 63.5% |
| Comanche | 2.1 /100 | #237 | Tragic 63.5% |
| Immigrants | Zimbabwe | 2.0 /100 | #238 | Tragic 63.5% |