West Indian vs Immigrants from Japan Family Households
COMPARE
West Indian
Immigrants from Japan
Family Households
Family Households Comparison
West Indians
Immigrants from Japan
63.1%
FAMILY HOUSEHOLDS
0.3/ 100
METRIC RATING
275th/ 347
METRIC RANK
63.4%
FAMILY HOUSEHOLDS
1.4/ 100
METRIC RATING
250th/ 347
METRIC RANK
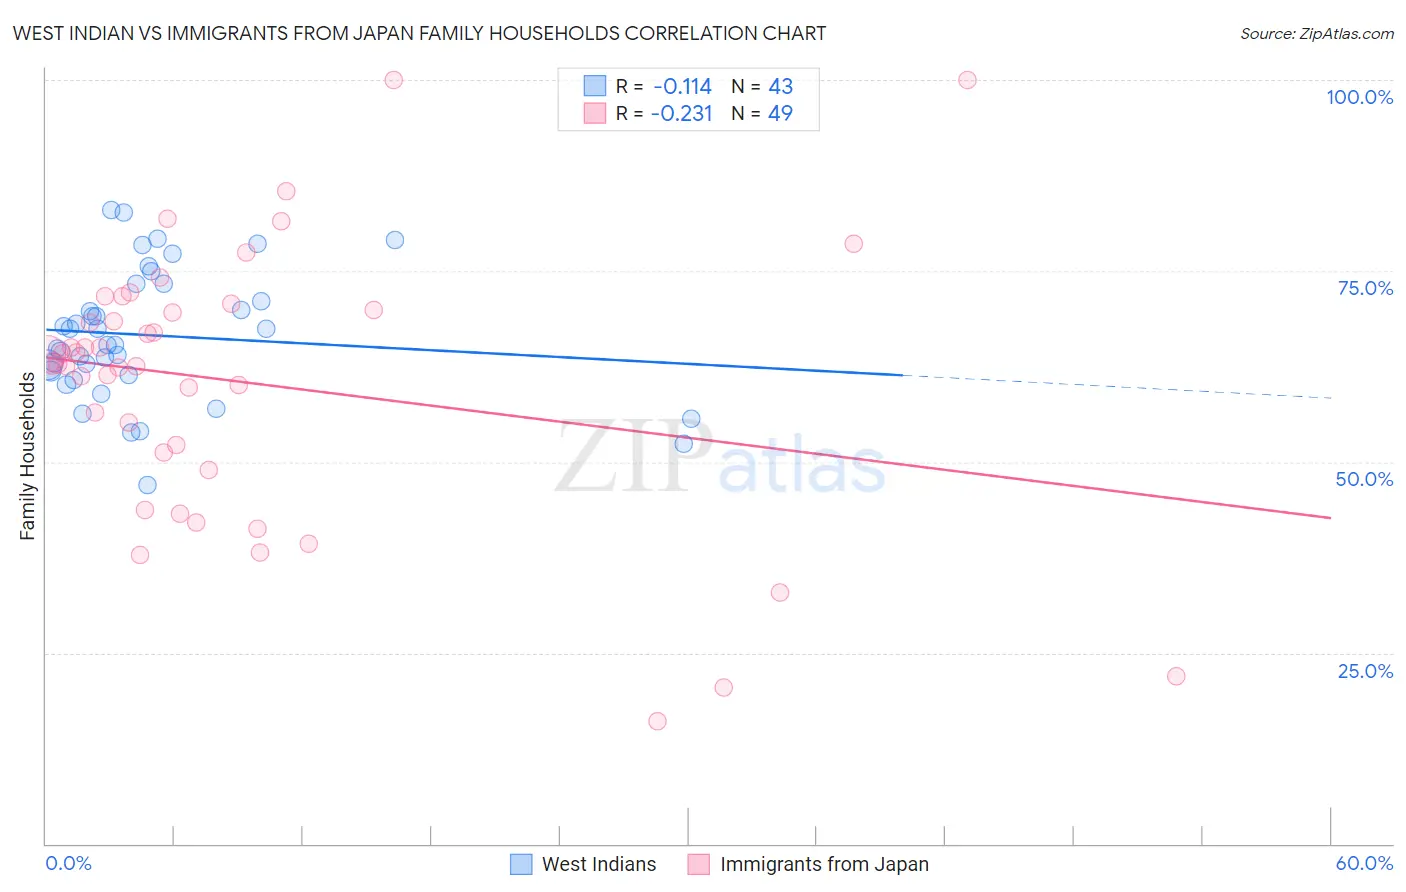
West Indian vs Immigrants from Japan Family Households Correlation Chart
The statistical analysis conducted on geographies consisting of 253,859,677 people shows a poor negative correlation between the proportion of West Indians and percentage of family households in the United States with a correlation coefficient (R) of -0.114 and weighted average of 63.1%. Similarly, the statistical analysis conducted on geographies consisting of 339,993,519 people shows a weak negative correlation between the proportion of Immigrants from Japan and percentage of family households in the United States with a correlation coefficient (R) of -0.231 and weighted average of 63.4%, a difference of 0.51%.
Family Households Correlation Summary
| Measurement | West Indian | Immigrants from Japan |
| Minimum | 47.0% | 16.1% |
| Maximum | 83.0% | 100.0% |
| Range | 36.0% | 83.9% |
| Mean | 66.5% | 60.4% |
| Median | 65.3% | 62.8% |
| Interquartile 25% (IQ1) | 61.3% | 50.1% |
| Interquartile 75% (IQ3) | 73.3% | 70.3% |
| Interquartile Range (IQR) | 12.0% | 20.2% |
| Standard Deviation (Sample) | 8.5% | 17.9% |
| Standard Deviation (Population) | 8.4% | 17.7% |
Similar Demographics by Family Households
Demographics Similar to West Indians by Family Households
In terms of family households, the demographic groups most similar to West Indians are Lumbee (63.1%, a difference of 0.0%), Immigrants from Kazakhstan (63.1%, a difference of 0.010%), Serbian (63.0%, a difference of 0.010%), Immigrants from Croatia (63.1%, a difference of 0.020%), and Immigrants from Turkey (63.1%, a difference of 0.020%).
| Demographics | Rating | Rank | Family Households |
| Immigrants | Singapore | 0.4 /100 | #268 | Tragic 63.1% |
| Yugoslavians | 0.4 /100 | #269 | Tragic 63.1% |
| Immigrants | Austria | 0.3 /100 | #270 | Tragic 63.1% |
| Immigrants | Croatia | 0.3 /100 | #271 | Tragic 63.1% |
| Immigrants | Turkey | 0.3 /100 | #272 | Tragic 63.1% |
| Immigrants | Kazakhstan | 0.3 /100 | #273 | Tragic 63.1% |
| Lumbee | 0.3 /100 | #274 | Tragic 63.1% |
| West Indians | 0.3 /100 | #275 | Tragic 63.1% |
| Serbians | 0.3 /100 | #276 | Tragic 63.0% |
| Ottawa | 0.3 /100 | #277 | Tragic 63.0% |
| Immigrants | Belgium | 0.2 /100 | #278 | Tragic 63.0% |
| Immigrants | Yemen | 0.2 /100 | #279 | Tragic 63.0% |
| Immigrants | Bulgaria | 0.2 /100 | #280 | Tragic 63.0% |
| Estonians | 0.2 /100 | #281 | Tragic 62.9% |
| New Zealanders | 0.1 /100 | #282 | Tragic 62.9% |
Demographics Similar to Immigrants from Japan by Family Households
In terms of family households, the demographic groups most similar to Immigrants from Japan are Russian (63.4%, a difference of 0.010%), Dominican (63.4%, a difference of 0.030%), Immigrants from Uzbekistan (63.4%, a difference of 0.040%), Immigrants from Ghana (63.4%, a difference of 0.050%), and Taiwanese (63.3%, a difference of 0.050%).
| Demographics | Rating | Rank | Family Households |
| Immigrants | Czechoslovakia | 1.8 /100 | #243 | Tragic 63.4% |
| Eastern Europeans | 1.6 /100 | #244 | Tragic 63.4% |
| Immigrants | Dominica | 1.6 /100 | #245 | Tragic 63.4% |
| Immigrants | Ghana | 1.6 /100 | #246 | Tragic 63.4% |
| Immigrants | Uzbekistan | 1.5 /100 | #247 | Tragic 63.4% |
| Dominicans | 1.5 /100 | #248 | Tragic 63.4% |
| Russians | 1.4 /100 | #249 | Tragic 63.4% |
| Immigrants | Japan | 1.4 /100 | #250 | Tragic 63.4% |
| Taiwanese | 1.2 /100 | #251 | Tragic 63.3% |
| Bahamians | 1.1 /100 | #252 | Tragic 63.3% |
| Immigrants | Dominican Republic | 1.0 /100 | #253 | Tragic 63.3% |
| Slovaks | 1.0 /100 | #254 | Tragic 63.3% |
| Potawatomi | 1.0 /100 | #255 | Tragic 63.3% |
| Luxembourgers | 0.9 /100 | #256 | Tragic 63.3% |
| Icelanders | 0.8 /100 | #257 | Tragic 63.3% |