Ute vs Iranian Births to Unmarried Women
COMPARE
Ute
Iranian
Births to Unmarried Women
Births to Unmarried Women Comparison
Ute
Iranians
33.0%
BIRTHS TO UNMARRIED WOMEN
14.4/ 100
METRIC RATING
203rd/ 347
METRIC RANK
25.3%
BIRTHS TO UNMARRIED WOMEN
100.0/ 100
METRIC RATING
13th/ 347
METRIC RANK
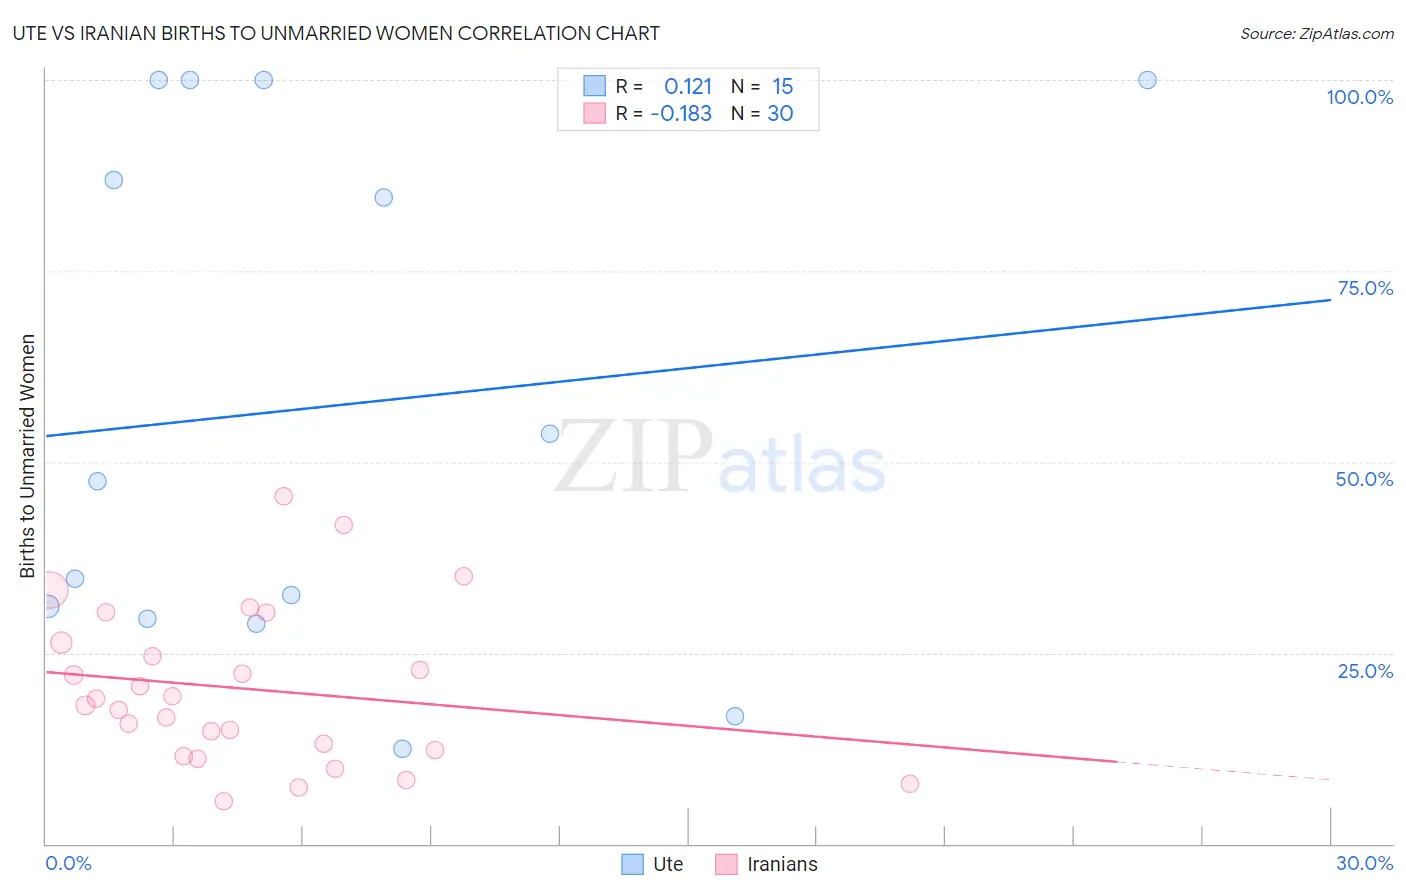
Ute vs Iranian Births to Unmarried Women Correlation Chart
The statistical analysis conducted on geographies consisting of 54,718,542 people shows a poor positive correlation between the proportion of Ute and percentage of births to unmarried women in the United States with a correlation coefficient (R) of 0.121 and weighted average of 33.0%. Similarly, the statistical analysis conducted on geographies consisting of 297,991,005 people shows a poor negative correlation between the proportion of Iranians and percentage of births to unmarried women in the United States with a correlation coefficient (R) of -0.183 and weighted average of 25.3%, a difference of 30.4%.
Births to Unmarried Women Correlation Summary
| Measurement | Ute | Iranian |
| Minimum | 12.5% | 5.5% |
| Maximum | 100.0% | 45.5% |
| Range | 87.5% | 40.0% |
| Mean | 57.2% | 20.3% |
| Median | 47.5% | 18.6% |
| Interquartile 25% (IQ1) | 29.4% | 12.2% |
| Interquartile 75% (IQ3) | 100.0% | 26.4% |
| Interquartile Range (IQR) | 70.6% | 14.2% |
| Standard Deviation (Sample) | 33.9% | 10.2% |
| Standard Deviation (Population) | 32.7% | 10.1% |
Similar Demographics by Births to Unmarried Women
Demographics Similar to Ute by Births to Unmarried Women
In terms of births to unmarried women, the demographic groups most similar to Ute are Immigrants from Africa (33.0%, a difference of 0.020%), German Russian (33.1%, a difference of 0.25%), Uruguayan (33.1%, a difference of 0.31%), Immigrants from Micronesia (32.9%, a difference of 0.38%), and Immigrants from Burma/Myanmar (32.9%, a difference of 0.39%).
| Demographics | Rating | Rank | Births to Unmarried Women |
| Immigrants | Colombia | 21.7 /100 | #196 | Fair 32.6% |
| Immigrants | Immigrants | 20.6 /100 | #197 | Fair 32.7% |
| Costa Ricans | 20.3 /100 | #198 | Fair 32.7% |
| Immigrants | Thailand | 18.9 /100 | #199 | Poor 32.8% |
| Immigrants | Germany | 18.8 /100 | #200 | Poor 32.8% |
| Immigrants | Burma/Myanmar | 16.7 /100 | #201 | Poor 32.9% |
| Immigrants | Micronesia | 16.6 /100 | #202 | Poor 32.9% |
| Ute | 14.4 /100 | #203 | Poor 33.0% |
| Immigrants | Africa | 14.3 /100 | #204 | Poor 33.0% |
| German Russians | 13.1 /100 | #205 | Poor 33.1% |
| Uruguayans | 12.8 /100 | #206 | Poor 33.1% |
| Immigrants | Sudan | 11.5 /100 | #207 | Poor 33.2% |
| Hawaiians | 11.3 /100 | #208 | Poor 33.2% |
| Whites/Caucasians | 10.7 /100 | #209 | Poor 33.3% |
| Scotch-Irish | 10.7 /100 | #210 | Poor 33.3% |
Demographics Similar to Iranians by Births to Unmarried Women
In terms of births to unmarried women, the demographic groups most similar to Iranians are Immigrants from Lebanon (25.3%, a difference of 0.12%), Indian (Asian) (25.3%, a difference of 0.14%), Immigrants from Israel (25.1%, a difference of 0.61%), Immigrants from Eastern Asia (25.0%, a difference of 1.0%), and Immigrants from Singapore (25.6%, a difference of 1.3%).
| Demographics | Rating | Rank | Births to Unmarried Women |
| Immigrants | Iran | 100.0 /100 | #6 | Exceptional 24.0% |
| Thais | 100.0 /100 | #7 | Exceptional 24.0% |
| Immigrants | China | 100.0 /100 | #8 | Exceptional 24.7% |
| Immigrants | South Central Asia | 100.0 /100 | #9 | Exceptional 24.7% |
| Immigrants | Eastern Asia | 100.0 /100 | #10 | Exceptional 25.0% |
| Immigrants | Israel | 100.0 /100 | #11 | Exceptional 25.1% |
| Indians (Asian) | 100.0 /100 | #12 | Exceptional 25.3% |
| Iranians | 100.0 /100 | #13 | Exceptional 25.3% |
| Immigrants | Lebanon | 100.0 /100 | #14 | Exceptional 25.3% |
| Immigrants | Singapore | 100.0 /100 | #15 | Exceptional 25.6% |
| Immigrants | Belarus | 100.0 /100 | #16 | Exceptional 25.6% |
| Immigrants | Uzbekistan | 100.0 /100 | #17 | Exceptional 25.8% |
| Immigrants | Armenia | 99.9 /100 | #18 | Exceptional 26.1% |
| Armenians | 99.9 /100 | #19 | Exceptional 26.2% |
| Immigrants | Korea | 99.9 /100 | #20 | Exceptional 26.3% |