Pennsylvania German vs Eastern European Divorced or Separated
COMPARE
Pennsylvania German
Eastern European
Divorced or Separated
Divorced or Separated Comparison
Pennsylvania Germans
Eastern Europeans
12.1%
DIVORCED OR SEPARATED
48.9/ 100
METRIC RATING
176th/ 347
METRIC RANK
11.3%
DIVORCED OR SEPARATED
99.9/ 100
METRIC RATING
54th/ 347
METRIC RANK
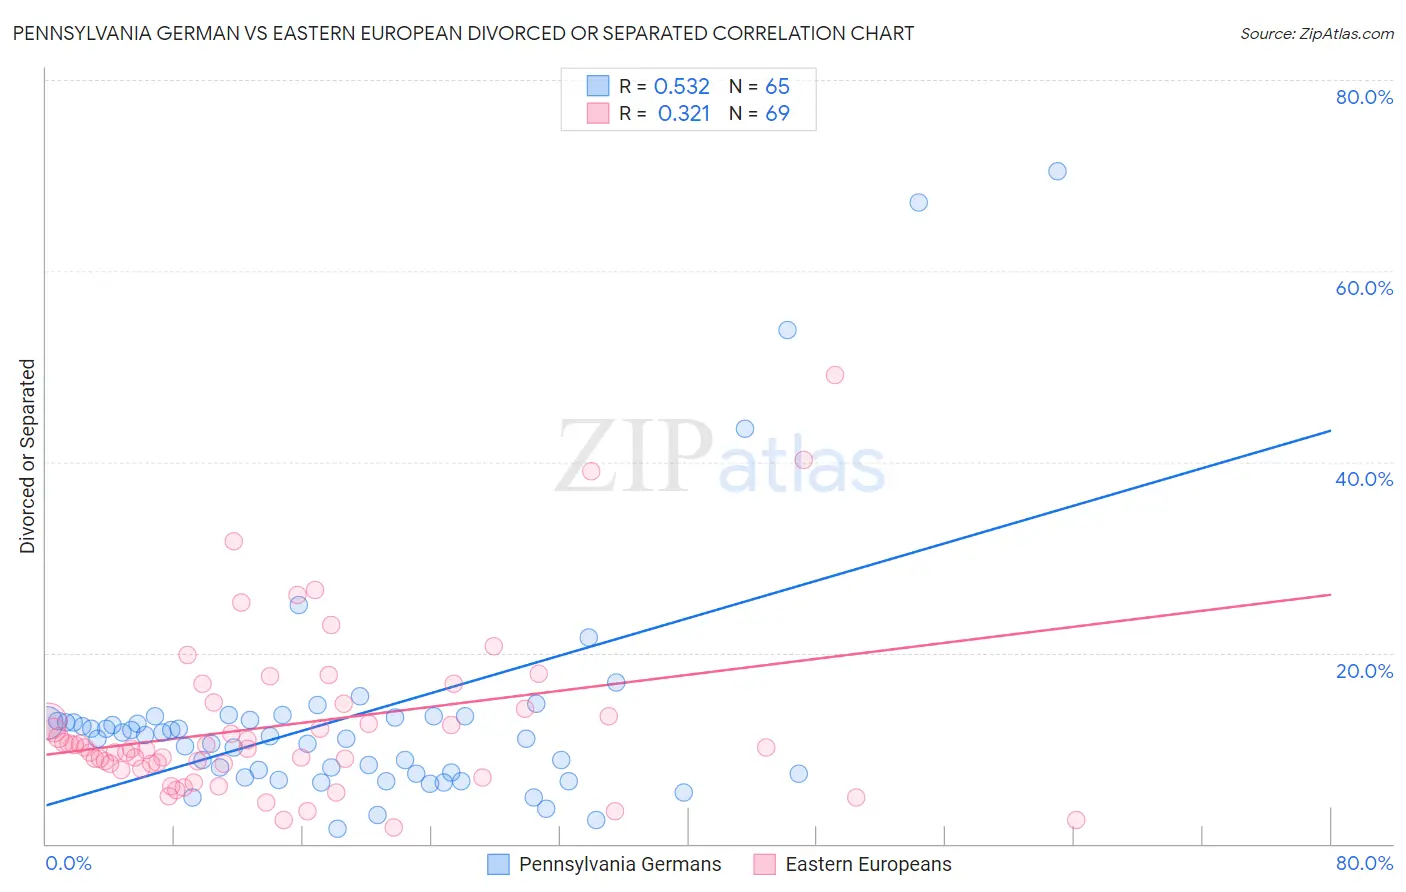
Pennsylvania German vs Eastern European Divorced or Separated Correlation Chart
The statistical analysis conducted on geographies consisting of 234,077,990 people shows a substantial positive correlation between the proportion of Pennsylvania Germans and percentage of population currently divorced or separated in the United States with a correlation coefficient (R) of 0.532 and weighted average of 12.1%. Similarly, the statistical analysis conducted on geographies consisting of 461,055,019 people shows a mild positive correlation between the proportion of Eastern Europeans and percentage of population currently divorced or separated in the United States with a correlation coefficient (R) of 0.321 and weighted average of 11.3%, a difference of 6.7%.
Divorced or Separated Correlation Summary
| Measurement | Pennsylvania German | Eastern European |
| Minimum | 1.6% | 1.7% |
| Maximum | 70.4% | 49.1% |
| Range | 68.8% | 47.4% |
| Mean | 13.3% | 12.5% |
| Median | 11.2% | 10.0% |
| Interquartile 25% (IQ1) | 7.3% | 8.1% |
| Interquartile 75% (IQ3) | 13.1% | 14.3% |
| Interquartile Range (IQR) | 5.8% | 6.3% |
| Standard Deviation (Sample) | 12.7% | 8.9% |
| Standard Deviation (Population) | 12.6% | 8.8% |
Similar Demographics by Divorced or Separated
Demographics Similar to Pennsylvania Germans by Divorced or Separated
In terms of divorced or separated, the demographic groups most similar to Pennsylvania Germans are Hawaiian (12.1%, a difference of 0.040%), Immigrants from Sierra Leone (12.1%, a difference of 0.040%), Brazilian (12.1%, a difference of 0.040%), Immigrants from Moldova (12.1%, a difference of 0.050%), and Ghanaian (12.1%, a difference of 0.11%).
| Demographics | Rating | Rank | Divorced or Separated |
| Immigrants | Peru | 57.0 /100 | #169 | Average 12.0% |
| Mexican American Indians | 55.8 /100 | #170 | Average 12.0% |
| Costa Ricans | 53.3 /100 | #171 | Average 12.0% |
| Immigrants | Mexico | 53.2 /100 | #172 | Average 12.0% |
| Immigrants | Moldova | 50.4 /100 | #173 | Average 12.1% |
| Hawaiians | 50.0 /100 | #174 | Average 12.1% |
| Immigrants | Sierra Leone | 50.0 /100 | #175 | Average 12.1% |
| Pennsylvania Germans | 48.9 /100 | #176 | Average 12.1% |
| Brazilians | 47.7 /100 | #177 | Average 12.1% |
| Ghanaians | 45.9 /100 | #178 | Average 12.1% |
| Immigrants | Western Europe | 45.6 /100 | #179 | Average 12.1% |
| Barbadians | 45.0 /100 | #180 | Average 12.1% |
| Immigrants | Canada | 44.0 /100 | #181 | Average 12.1% |
| Immigrants | Ethiopia | 43.1 /100 | #182 | Average 12.1% |
| Immigrants | Central America | 42.9 /100 | #183 | Average 12.1% |
Demographics Similar to Eastern Europeans by Divorced or Separated
In terms of divorced or separated, the demographic groups most similar to Eastern Europeans are Immigrants from Yemen (11.3%, a difference of 0.010%), Immigrants from Philippines (11.3%, a difference of 0.070%), Immigrants from Vietnam (11.3%, a difference of 0.080%), Immigrants from Lithuania (11.3%, a difference of 0.11%), and Sri Lankan (11.3%, a difference of 0.14%).
| Demographics | Rating | Rank | Divorced or Separated |
| Immigrants | Poland | 100.0 /100 | #47 | Exceptional 11.2% |
| Immigrants | Turkey | 100.0 /100 | #48 | Exceptional 11.2% |
| Immigrants | Saudi Arabia | 100.0 /100 | #49 | Exceptional 11.2% |
| Bolivians | 100.0 /100 | #50 | Exceptional 11.2% |
| Immigrants | Bolivia | 100.0 /100 | #51 | Exceptional 11.3% |
| Immigrants | Australia | 99.9 /100 | #52 | Exceptional 11.3% |
| Immigrants | Lithuania | 99.9 /100 | #53 | Exceptional 11.3% |
| Eastern Europeans | 99.9 /100 | #54 | Exceptional 11.3% |
| Immigrants | Yemen | 99.9 /100 | #55 | Exceptional 11.3% |
| Immigrants | Philippines | 99.9 /100 | #56 | Exceptional 11.3% |
| Immigrants | Vietnam | 99.9 /100 | #57 | Exceptional 11.3% |
| Sri Lankans | 99.9 /100 | #58 | Exceptional 11.3% |
| Israelis | 99.9 /100 | #59 | Exceptional 11.3% |
| Immigrants | Russia | 99.9 /100 | #60 | Exceptional 11.3% |
| Koreans | 99.9 /100 | #61 | Exceptional 11.3% |