Pennsylvania German vs Eastern European Bachelor's Degree

COMPARE

Pennsylvania German
Race
Ancestry
AfghanAfricanAlaska NativeAlaskan AthabascanAlbanianAleutAlsatianAmericanApacheArabArapahoArgentineanArmenianAssyrian/Chaldean/SyriacAustralianAustrianBahamianBangladeshiBarbadianBasqueBelgianBelizeanBermudanBhutaneseBlackfeetBolivianBrazilianBritishBritish West IndianBulgarianBurmeseCajunCambodianCanadianCape VerdeanCarpatho RusynCelticCentral AmericanCentral American IndianCherokeeCheyenneChickasawChileanChineseChippewaChoctawColombianColvilleComancheCosta RicanCreeCreekCroatianCrowCubanCypriotCzechCzechoslovakianDanishDelawareDominicanDutchDutch West IndianEcuadorianEgyptianEnglishEstonianEthiopianEuropeanFijianFilipinoFinnishFrenchFrench American IndianFrench CanadianGermanGerman RussianGhanaianGreekGuamanian/ChamorroGuatemalanGuyaneseHaitianHmongHonduranHopiHoumaHungarianIcelanderIndian (Asian)IndonesianInupiatIranianIraqiIrishIroquoisIsraeliItalianJamaicanJapaneseJordanianKenyanKiowaKoreanLaotianLatvianLebaneseLiberianLithuanianLumbeeLuxembourgerMacedonianMalaysianMalteseMarshalleseMenomineeMexicanMexican American IndianMongolianMoroccanNative HawaiianNavajoNepaleseNew ZealanderNicaraguanNigerianNorthern EuropeanNorwegianOkinawanOsageOttawaPaiutePakistaniPalestinianPanamanianParaguayanPennsylvania GermanPeruvianPimaPolishPortuguesePotawatomiPuebloPuerto RicanPuget Sound SalishRomanianRussianSalvadoranSamoanScandinavianScotch-IrishScottishSeminoleSenegaleseSerbianShoshoneSierra LeoneanSiouxSlavicSlovakSloveneSomaliSouth AfricanSouth AmericanSouth American IndianSoviet UnionSpaniardSpanishSpanish AmericanSpanish American IndianSri LankanSubsaharan AfricanSudaneseSwedishSwissSyrianTaiwaneseThaiTlingit-HaidaTohono O'OdhamTonganTrinidadian and TobagonianTsimshianTurkishU.S. Virgin IslanderUgandanUkrainianUruguayanUteVenezuelanVietnameseWelshWest IndianYakamaYaquiYugoslavianYumanYup'ikZimbabwean
Immigration
NonimmigrantsImmigrantsAfghanistanAfricaAlbaniaArgentinaArmeniaAsiaAustraliaAustriaBahamasBangladeshBarbadosBelarusBelgiumBelizeBoliviaBosnia and HerzegovinaBrazilBulgariaBurma/MyanmarCabo VerdeCambodiaCameroonCanadaCaribbeanCentral AmericaChileChinaColombiaCongoCosta RicaCroatiaCubaCzechoslovakiaDenmarkDominicaDominican RepublicEastern AfricaEastern AsiaEastern EuropeEcuadorEgyptEl SalvadorEnglandEritreaEthiopiaEuropeFijiFranceGermanyGhanaGreeceGrenadaGuatemalaGuyanaHaitiHondurasHong KongHungaryIndiaIndonesiaIranIraqIrelandIsraelItalyJamaicaJapanJordanKazakhstanKenyaKoreaKuwaitLaosLatin AmericaLatviaLebanonLiberiaLithuaniaMalaysiaMexicoMicronesiaMiddle AfricaMoldovaMoroccoNepalNetherlandsNicaraguaNigeriaNorth AmericaNorth MacedoniaNorthern AfricaNorthern EuropeNorwayOceaniaPakistanPanamaPeruPhilippinesPolandPortugalRomaniaRussiaSaudi ArabiaScotlandSenegalSerbiaSierra LeoneSingaporeSomaliaSouth AfricaSouth AmericaSouth Central AsiaSouth Eastern AsiaSouthern EuropeSpainSri LankaSt. Vincent and the GrenadinesSudanSwedenSwitzerlandSyriaTaiwanThailandTrinidad and TobagoTurkeyUgandaUkraineUruguayUzbekistanVenezuelaVietnamWest IndiesWestern AfricaWestern AsiaWestern EuropeYemenZaireZimbabweAzores
Eastern European
Race
Ancestry
AfghanAfricanAlaska NativeAlaskan AthabascanAlbanianAleutAlsatianAmericanApacheArabArapahoArgentineanArmenianAssyrian/Chaldean/SyriacAustralianAustrianBahamianBangladeshiBarbadianBasqueBelgianBelizeanBermudanBhutaneseBlackfeetBolivianBrazilianBritishBritish West IndianBulgarianBurmeseCajunCambodianCanadianCape VerdeanCarpatho RusynCelticCentral AmericanCentral American IndianCherokeeCheyenneChickasawChileanChineseChippewaChoctawColombianColvilleComancheCosta RicanCreeCreekCroatianCrowCubanCypriotCzechCzechoslovakianDanishDelawareDominicanDutchDutch West IndianEastern EuropeanEcuadorianEgyptianEnglishEstonianEthiopianEuropeanFijianFilipinoFinnishFrenchFrench American IndianFrench CanadianGermanGerman RussianGhanaianGreekGuamanian/ChamorroGuatemalanGuyaneseHaitianHmongHonduranHopiHoumaHungarianIcelanderIndian (Asian)IndonesianInupiatIranianIraqiIrishIroquoisIsraeliItalianJamaicanJapaneseJordanianKenyanKiowaKoreanLaotianLatvianLebaneseLiberianLithuanianLumbeeLuxembourgerMacedonianMalaysianMalteseMarshalleseMenomineeMexicanMexican American IndianMongolianMoroccanNative HawaiianNavajoNepaleseNew ZealanderNicaraguanNigerianNorthern EuropeanNorwegianOkinawanOsageOttawaPaiutePakistaniPalestinianPanamanianParaguayanPeruvianPimaPolishPortuguesePotawatomiPuebloPuerto RicanPuget Sound SalishRomanianRussianSalvadoranSamoanScandinavianScotch-IrishScottishSeminoleSenegaleseSerbianShoshoneSierra LeoneanSiouxSlavicSlovakSloveneSomaliSouth AfricanSouth AmericanSouth American IndianSoviet UnionSpaniardSpanishSpanish AmericanSpanish American IndianSri LankanSubsaharan AfricanSudaneseSwedishSwissSyrianTaiwaneseThaiTlingit-HaidaTohono O'OdhamTonganTrinidadian and TobagonianTsimshianTurkishU.S. Virgin IslanderUgandanUkrainianUruguayanUteVenezuelanVietnameseWelshWest IndianYakamaYaquiYugoslavianYumanYup'ikZimbabwean
Immigration
NonimmigrantsImmigrantsAfghanistanAfricaAlbaniaArgentinaArmeniaAsiaAustraliaAustriaBahamasBangladeshBarbadosBelarusBelgiumBelizeBoliviaBosnia and HerzegovinaBrazilBulgariaBurma/MyanmarCabo VerdeCambodiaCameroonCanadaCaribbeanCentral AmericaChileChinaColombiaCongoCosta RicaCroatiaCubaCzechoslovakiaDenmarkDominicaDominican RepublicEastern AfricaEastern AsiaEastern EuropeEcuadorEgyptEl SalvadorEnglandEritreaEthiopiaEuropeFijiFranceGermanyGhanaGreeceGrenadaGuatemalaGuyanaHaitiHondurasHong KongHungaryIndiaIndonesiaIranIraqIrelandIsraelItalyJamaicaJapanJordanKazakhstanKenyaKoreaKuwaitLaosLatin AmericaLatviaLebanonLiberiaLithuaniaMalaysiaMexicoMicronesiaMiddle AfricaMoldovaMoroccoNepalNetherlandsNicaraguaNigeriaNorth AmericaNorth MacedoniaNorthern AfricaNorthern EuropeNorwayOceaniaPakistanPanamaPeruPhilippinesPolandPortugalRomaniaRussiaSaudi ArabiaScotlandSenegalSerbiaSierra LeoneSingaporeSomaliaSouth AfricaSouth AmericaSouth Central AsiaSouth Eastern AsiaSouthern EuropeSpainSri LankaSt. Vincent and the GrenadinesSudanSwedenSwitzerlandSyriaTaiwanThailandTrinidad and TobagoTurkeyUgandaUkraineUruguayUzbekistanVenezuelaVietnamWest IndiesWestern AfricaWestern AsiaWestern EuropeYemenZaireZimbabweAzores
Bachelor's Degree
Income
Poverty
Unemployment
Labor Participation
Family Structure
Vehicle Availability
Education Level
Disability

Bachelor's Degree Comparison

Pennsylvania Germans

Eastern Europeans

Tragic
Exceptional
28.4%
BACHELOR'S DEGREE
0.0/ 100
METRIC RATING
325th/ 347
METRIC RANK
47.5%
BACHELOR'S DEGREE
100.0/ 100
METRIC RATING
17th/ 347
METRIC RANK

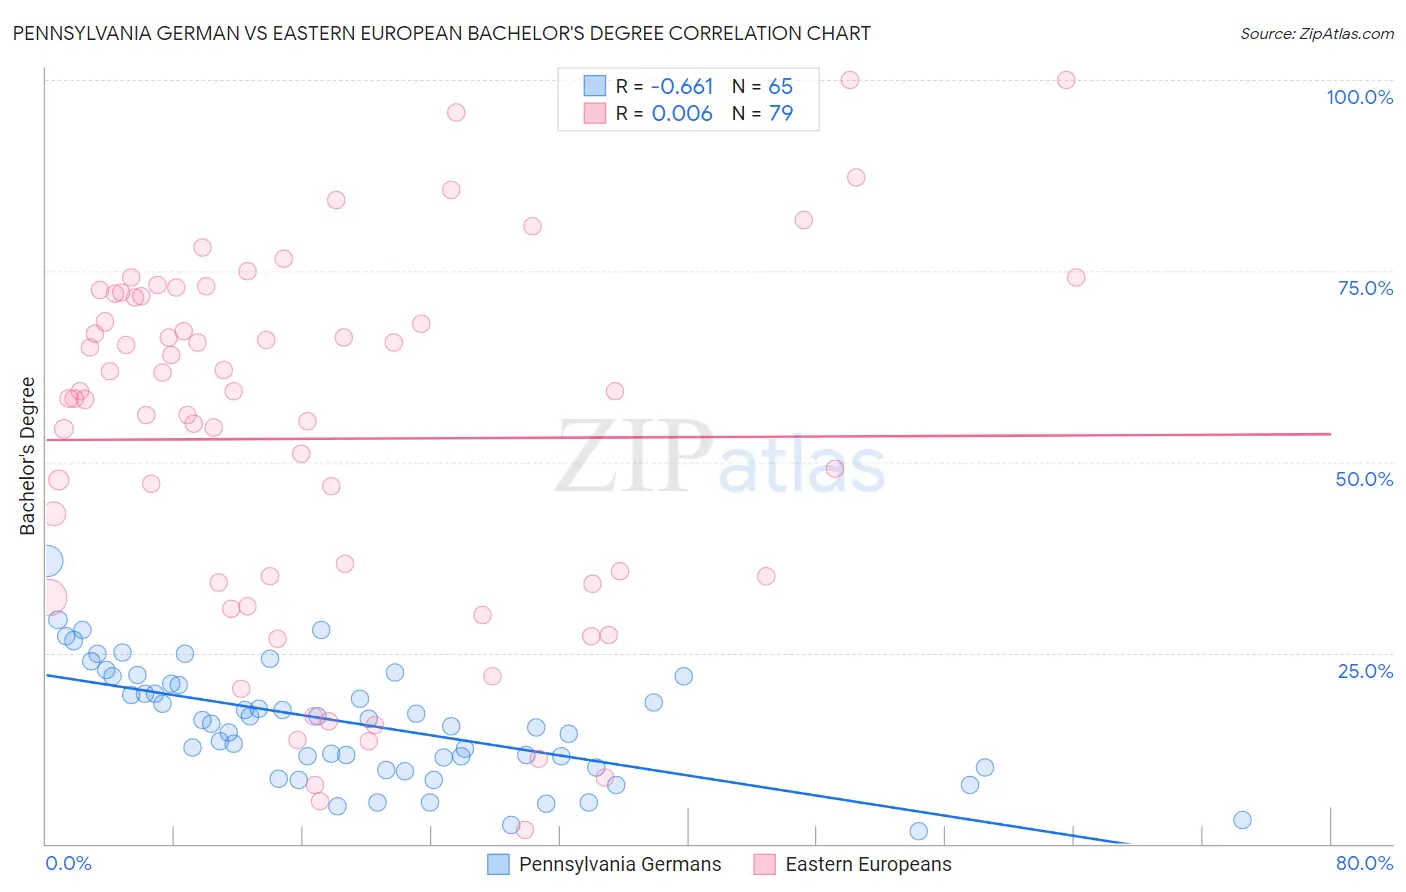
Pennsylvania German vs Eastern European Bachelor's Degree Correlation Chart

The statistical analysis conducted on geographies consisting of 234,090,370 people shows a significant negative correlation between the proportion of Pennsylvania Germans and percentage of population with at least bachelor's degree education in the United States with a correlation coefficient (R) of -0.661 and weighted average of 28.4%. Similarly, the statistical analysis conducted on geographies consisting of 461,197,677 people shows no correlation between the proportion of Eastern Europeans and percentage of population with at least bachelor's degree education in the United States with a correlation coefficient (R) of 0.006 and weighted average of 47.5%, a difference of 67.4%.
Pennsylvania German vs Eastern European Bachelor's Degree

Bachelor's Degree Correlation Summary

MeasurementPennsylvania GermanEastern European
Minimum1.6%1.8%
Maximum37.0%100.0%
Range35.5%98.2%
Mean15.7%53.0%
Median15.7%58.3%
Interquartile 25% (IQ1)10.0%34.0%
Interquartile 75% (IQ3)21.4%71.7%
Interquartile Range (IQR)11.4%37.7%
Standard Deviation (Sample)7.5%24.1%
Standard Deviation (Population)7.4%23.9%

Similar Demographics by Bachelor's Degree

Demographics Similar to Pennsylvania Germans by Bachelor's Degree

In terms of bachelor's degree, the demographic groups most similar to Pennsylvania Germans are Apache (28.3%, a difference of 0.39%), Dutch West Indian (28.5%, a difference of 0.45%), Paiute (28.1%, a difference of 1.1%), Fijian (28.7%, a difference of 1.2%), and Tsimshian (28.8%, a difference of 1.3%).
DemographicsRating | RankBachelor's Degree
Yaqui
0.0
/100
|
#318
Tragic
29.0%
Creek
0.0
/100
|
#319
Tragic
28.9%
Kiowa
0.0
/100
|
#320
Tragic
28.8%
Alaskan Athabascans
0.0
/100
|
#321
Tragic
28.8%
Tsimshian
0.0
/100
|
#322
Tragic
28.8%
Fijians
0.0
/100
|
#323
Tragic
28.7%
Dutch West Indians
0.0
/100
|
#324
Tragic
28.5%
Pennsylvania Germans
0.0
/100
|
#325
Tragic
28.4%
Apache
0.0
/100
|
#326
Tragic
28.3%
Paiute
0.0
/100
|
#327
Tragic
28.1%
Crow
0.0
/100
|
#328
Tragic
27.7%
Immigrants | Central America
0.0
/100
|
#329
Tragic
27.5%
Spanish American Indians
0.0
/100
|
#330
Tragic
27.5%
Immigrants | Azores
0.0
/100
|
#331
Tragic
27.3%
Menominee
0.0
/100
|
#332
Tragic
27.3%

Demographics Similar to Eastern Europeans by Bachelor's Degree

In terms of bachelor's degree, the demographic groups most similar to Eastern Europeans are Indian (Asian) (47.4%, a difference of 0.15%), Cambodian (47.2%, a difference of 0.58%), Immigrants from Switzerland (47.1%, a difference of 0.80%), Immigrants from Ireland (47.1%, a difference of 0.81%), and Soviet Union (47.9%, a difference of 0.86%).
DemographicsRating | RankBachelor's Degree
Cypriots
100.0
/100
|
#10
Exceptional
49.0%
Immigrants | Australia
100.0
/100
|
#11
Exceptional
48.5%
Immigrants | China
100.0
/100
|
#12
Exceptional
48.4%
Immigrants | South Central Asia
100.0
/100
|
#13
Exceptional
48.3%
Immigrants | Hong Kong
100.0
/100
|
#14
Exceptional
48.2%
Immigrants | Eastern Asia
100.0
/100
|
#15
Exceptional
48.1%
Soviet Union
100.0
/100
|
#16
Exceptional
47.9%
Eastern Europeans
100.0
/100
|
#17
Exceptional
47.5%
Indians (Asian)
100.0
/100
|
#18
Exceptional
47.4%
Cambodians
100.0
/100
|
#19
Exceptional
47.2%
Immigrants | Switzerland
100.0
/100
|
#20
Exceptional
47.1%
Immigrants | Ireland
100.0
/100
|
#21
Exceptional
47.1%
Immigrants | Belgium
100.0
/100
|
#22
Exceptional
47.0%
Immigrants | Sweden
100.0
/100
|
#23
Exceptional
47.0%
Immigrants | Korea
100.0
/100
|
#24
Exceptional
47.0%