Nigerian vs Immigrants from Indonesia Family Households

COMPARE

Nigerian
Race
Ancestry
AfghanAfricanAlaska NativeAlaskan AthabascanAlbanianAleutAlsatianAmericanApacheArabArapahoArgentineanArmenianAssyrian/Chaldean/SyriacAustralianAustrianBahamianBangladeshiBarbadianBasqueBelgianBelizeanBermudanBhutaneseBlackfeetBolivianBrazilianBritishBritish West IndianBulgarianBurmeseCajunCambodianCanadianCape VerdeanCarpatho RusynCelticCentral AmericanCentral American IndianCherokeeCheyenneChickasawChileanChineseChippewaChoctawColombianColvilleComancheCosta RicanCreeCreekCroatianCrowCubanCypriotCzechCzechoslovakianDanishDelawareDominicanDutchDutch West IndianEastern EuropeanEcuadorianEgyptianEnglishEstonianEthiopianEuropeanFijianFilipinoFinnishFrenchFrench American IndianFrench CanadianGermanGerman RussianGhanaianGreekGuamanian/ChamorroGuatemalanGuyaneseHaitianHmongHonduranHopiHoumaHungarianIcelanderIndian (Asian)IndonesianInupiatIranianIraqiIrishIroquoisIsraeliItalianJamaicanJapaneseJordanianKenyanKiowaKoreanLaotianLatvianLebaneseLiberianLithuanianLumbeeLuxembourgerMacedonianMalaysianMalteseMarshalleseMenomineeMexicanMexican American IndianMongolianMoroccanNative HawaiianNavajoNepaleseNew ZealanderNicaraguanNigerianNorthern EuropeanNorwegianOkinawanOsageOttawaPaiutePakistaniPalestinianPanamanianParaguayanPennsylvania GermanPeruvianPimaPolishPortuguesePotawatomiPuebloPuerto RicanPuget Sound SalishRomanianRussianSalvadoranSamoanScandinavianScotch-IrishScottishSeminoleSenegaleseSerbianShoshoneSierra LeoneanSiouxSlavicSlovakSloveneSomaliSouth AfricanSouth AmericanSouth American IndianSoviet UnionSpaniardSpanishSpanish AmericanSpanish American IndianSri LankanSubsaharan AfricanSudaneseSwedishSwissSyrianTaiwaneseThaiTlingit-HaidaTohono O'OdhamTonganTrinidadian and TobagonianTsimshianTurkishU.S. Virgin IslanderUgandanUkrainianUruguayanUteVenezuelanVietnameseWelshWest IndianYakamaYaquiYugoslavianYumanYup'ikZimbabwean
Immigration
NonimmigrantsImmigrantsAfghanistanAfricaAlbaniaArgentinaArmeniaAsiaAustraliaAustriaBahamasBangladeshBarbadosBelarusBelgiumBelizeBoliviaBosnia and HerzegovinaBrazilBulgariaBurma/MyanmarCabo VerdeCambodiaCameroonCanadaCaribbeanCentral AmericaChileChinaColombiaCongoCosta RicaCroatiaCubaCzechoslovakiaDenmarkDominicaDominican RepublicEastern AfricaEastern AsiaEastern EuropeEcuadorEgyptEl SalvadorEnglandEritreaEthiopiaEuropeFijiFranceGermanyGhanaGreeceGrenadaGuatemalaGuyanaHaitiHondurasHong KongHungaryIndiaIranIraqIrelandIsraelItalyJamaicaJapanJordanKazakhstanKenyaKoreaKuwaitLaosLatin AmericaLatviaLebanonLiberiaLithuaniaMalaysiaMexicoMicronesiaMiddle AfricaMoldovaMoroccoNepalNetherlandsNicaraguaNigeriaNorth AmericaNorth MacedoniaNorthern AfricaNorthern EuropeNorwayOceaniaPakistanPanamaPeruPhilippinesPolandPortugalRomaniaRussiaSaudi ArabiaScotlandSenegalSerbiaSierra LeoneSingaporeSomaliaSouth AfricaSouth AmericaSouth Central AsiaSouth Eastern AsiaSouthern EuropeSpainSri LankaSt. Vincent and the GrenadinesSudanSwedenSwitzerlandSyriaTaiwanThailandTrinidad and TobagoTurkeyUgandaUkraineUruguayUzbekistanVenezuelaVietnamWest IndiesWestern AfricaWestern AsiaWestern EuropeYemenZaireZimbabweAzores
Immigrants from Indonesia
Race
Ancestry
AfghanAfricanAlaska NativeAlaskan AthabascanAlbanianAleutAlsatianAmericanApacheArabArapahoArgentineanArmenianAssyrian/Chaldean/SyriacAustralianAustrianBahamianBangladeshiBarbadianBasqueBelgianBelizeanBermudanBhutaneseBlackfeetBolivianBrazilianBritishBritish West IndianBulgarianBurmeseCajunCambodianCanadianCape VerdeanCarpatho RusynCelticCentral AmericanCentral American IndianCherokeeCheyenneChickasawChileanChineseChippewaChoctawColombianColvilleComancheCosta RicanCreeCreekCroatianCrowCubanCypriotCzechCzechoslovakianDanishDelawareDominicanDutchDutch West IndianEastern EuropeanEcuadorianEgyptianEnglishEstonianEthiopianEuropeanFijianFilipinoFinnishFrenchFrench American IndianFrench CanadianGermanGerman RussianGhanaianGreekGuamanian/ChamorroGuatemalanGuyaneseHaitianHmongHonduranHopiHoumaHungarianIcelanderIndian (Asian)IndonesianInupiatIranianIraqiIrishIroquoisIsraeliItalianJamaicanJapaneseJordanianKenyanKiowaKoreanLaotianLatvianLebaneseLiberianLithuanianLumbeeLuxembourgerMacedonianMalaysianMalteseMarshalleseMenomineeMexicanMexican American IndianMongolianMoroccanNative HawaiianNavajoNepaleseNew ZealanderNicaraguanNorthern EuropeanNorwegianOkinawanOsageOttawaPaiutePakistaniPalestinianPanamanianParaguayanPennsylvania GermanPeruvianPimaPolishPortuguesePotawatomiPuebloPuerto RicanPuget Sound SalishRomanianRussianSalvadoranSamoanScandinavianScotch-IrishScottishSeminoleSenegaleseSerbianShoshoneSierra LeoneanSiouxSlavicSlovakSloveneSomaliSouth AfricanSouth AmericanSouth American IndianSoviet UnionSpaniardSpanishSpanish AmericanSpanish American IndianSri LankanSubsaharan AfricanSudaneseSwedishSwissSyrianTaiwaneseThaiTlingit-HaidaTohono O'OdhamTonganTrinidadian and TobagonianTsimshianTurkishU.S. Virgin IslanderUgandanUkrainianUruguayanUteVenezuelanVietnameseWelshWest IndianYakamaYaquiYugoslavianYumanYup'ikZimbabwean
Immigration
NonimmigrantsImmigrantsAfghanistanAfricaAlbaniaArgentinaArmeniaAsiaAustraliaAustriaBahamasBangladeshBarbadosBelarusBelgiumBelizeBoliviaBosnia and HerzegovinaBrazilBulgariaBurma/MyanmarCabo VerdeCambodiaCameroonCanadaCaribbeanCentral AmericaChileChinaColombiaCongoCosta RicaCroatiaCubaCzechoslovakiaDenmarkDominicaDominican RepublicEastern AfricaEastern AsiaEastern EuropeEcuadorEgyptEl SalvadorEnglandEritreaEthiopiaEuropeFijiFranceGermanyGhanaGreeceGrenadaGuatemalaGuyanaHaitiHondurasHong KongHungaryIndiaIndonesiaIranIraqIrelandIsraelItalyJamaicaJapanJordanKazakhstanKenyaKoreaKuwaitLaosLatin AmericaLatviaLebanonLiberiaLithuaniaMalaysiaMexicoMicronesiaMiddle AfricaMoldovaMoroccoNepalNetherlandsNicaraguaNigeriaNorth AmericaNorth MacedoniaNorthern AfricaNorthern EuropeNorwayOceaniaPakistanPanamaPeruPhilippinesPolandPortugalRomaniaRussiaSaudi ArabiaScotlandSenegalSerbiaSierra LeoneSingaporeSomaliaSouth AfricaSouth AmericaSouth Central AsiaSouth Eastern AsiaSouthern EuropeSpainSri LankaSt. Vincent and the GrenadinesSudanSwedenSwitzerlandSyriaTaiwanThailandTrinidad and TobagoTurkeyUgandaUkraineUruguayUzbekistanVenezuelaVietnamWest IndiesWestern AfricaWestern AsiaWestern EuropeYemenZaireZimbabweAzores
Family Households
Income
Poverty
Unemployment
Labor Participation
Family Structure
Vehicle Availability
Education Level
Disability

Family Households Comparison

Nigerians

Immigrants from Indonesia

Poor
Exceptional
63.9%
FAMILY HOUSEHOLDS
11.5/ 100
METRIC RATING
207th/ 347
METRIC RANK
66.0%
FAMILY HOUSEHOLDS
100.0/ 100
METRIC RATING
63rd/ 347
METRIC RANK

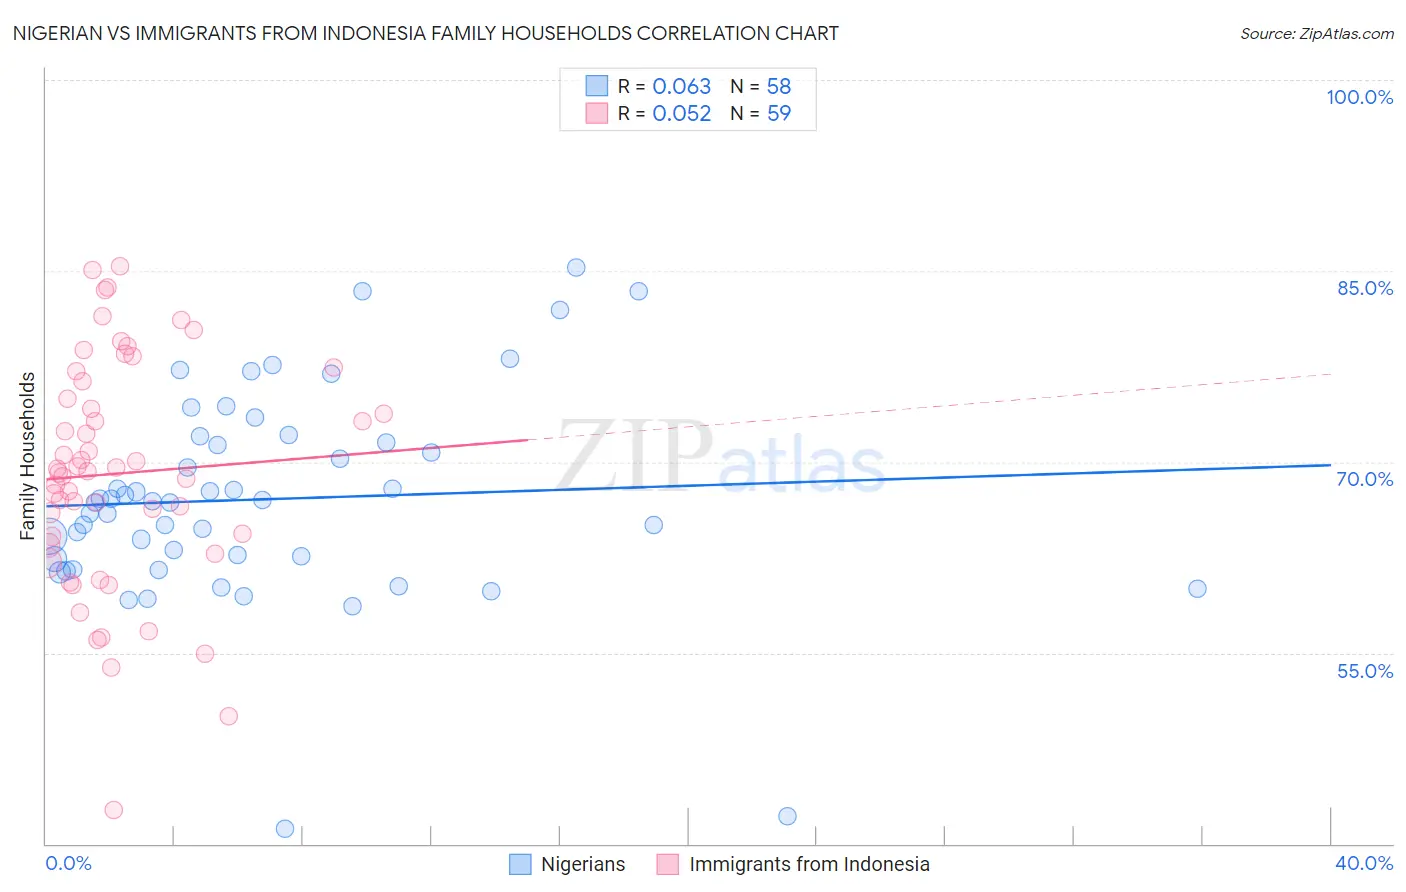
Nigerian vs Immigrants from Indonesia Family Households Correlation Chart

The statistical analysis conducted on geographies consisting of 332,466,874 people shows a slight positive correlation between the proportion of Nigerians and percentage of family households in the United States with a correlation coefficient (R) of 0.063 and weighted average of 63.9%. Similarly, the statistical analysis conducted on geographies consisting of 215,720,751 people shows a slight positive correlation between the proportion of Immigrants from Indonesia and percentage of family households in the United States with a correlation coefficient (R) of 0.052 and weighted average of 66.0%, a difference of 3.3%.
Nigerian vs Immigrants from Indonesia Family Households

Family Households Correlation Summary

MeasurementNigerianImmigrants from Indonesia
Minimum41.2%42.7%
Maximum85.2%85.4%
Range44.1%42.7%
Mean67.1%69.1%
Median66.9%69.3%
Interquartile 25% (IQ1)62.4%63.4%
Interquartile 75% (IQ3)71.6%76.3%
Interquartile Range (IQR)9.2%12.9%
Standard Deviation (Sample)8.2%9.1%
Standard Deviation (Population)8.2%9.0%

Similar Demographics by Family Households

Demographics Similar to Nigerians by Family Households

In terms of family households, the demographic groups most similar to Nigerians are Immigrants from Bangladesh (63.9%, a difference of 0.0%), Sierra Leonean (63.9%, a difference of 0.010%), Immigrants from Lithuania (63.9%, a difference of 0.020%), Brazilian (63.9%, a difference of 0.030%), and Immigrants from Uruguay (63.9%, a difference of 0.040%).
DemographicsRating | RankFamily Households
Immigrants | Malaysia
17.9
/100
|
#200
Poor
64.0%
Immigrants | Eastern Europe
17.2
/100
|
#201
Poor
64.0%
Iranians
13.5
/100
|
#202
Poor
63.9%
Norwegians
13.2
/100
|
#203
Poor
63.9%
Immigrants | Uruguay
12.8
/100
|
#204
Poor
63.9%
Brazilians
12.4
/100
|
#205
Poor
63.9%
Immigrants | Lithuania
12.1
/100
|
#206
Poor
63.9%
Nigerians
11.5
/100
|
#207
Poor
63.9%
Immigrants | Bangladesh
11.4
/100
|
#208
Poor
63.9%
Sierra Leoneans
11.2
/100
|
#209
Poor
63.9%
Immigrants | Thailand
9.6
/100
|
#210
Tragic
63.8%
Shoshone
9.4
/100
|
#211
Tragic
63.8%
Immigrants | Netherlands
9.4
/100
|
#212
Tragic
63.8%
Immigrants | Northern Europe
8.8
/100
|
#213
Tragic
63.8%
Celtics
8.0
/100
|
#214
Tragic
63.8%

Demographics Similar to Immigrants from Indonesia by Family Households

In terms of family households, the demographic groups most similar to Immigrants from Indonesia are Central American (66.0%, a difference of 0.040%), Pima (65.9%, a difference of 0.060%), Danish (66.0%, a difference of 0.070%), Costa Rican (65.9%, a difference of 0.070%), and South American (66.0%, a difference of 0.090%).
DemographicsRating | RankFamily Households
Immigrants | Hong Kong
100.0
/100
|
#56
Exceptional
66.1%
Pennsylvania Germans
100.0
/100
|
#57
Exceptional
66.1%
Immigrants | Asia
100.0
/100
|
#58
Exceptional
66.1%
Immigrants | Korea
100.0
/100
|
#59
Exceptional
66.0%
South Americans
100.0
/100
|
#60
Exceptional
66.0%
Danes
100.0
/100
|
#61
Exceptional
66.0%
Central Americans
100.0
/100
|
#62
Exceptional
66.0%
Immigrants | Indonesia
100.0
/100
|
#63
Exceptional
66.0%
Pima
99.9
/100
|
#64
Exceptional
65.9%
Costa Ricans
99.9
/100
|
#65
Exceptional
65.9%
Fijians
99.9
/100
|
#66
Exceptional
65.9%
Filipinos
99.9
/100
|
#67
Exceptional
65.9%
Japanese
99.9
/100
|
#68
Exceptional
65.9%
Malaysians
99.9
/100
|
#69
Exceptional
65.9%
Immigrants | Afghanistan
99.9
/100
|
#70
Exceptional
65.9%