Belizean vs Immigrants from Bahamas Divorced or Separated
COMPARE
Belizean
Immigrants from Bahamas
Divorced or Separated
Divorced or Separated Comparison
Belizeans
Immigrants from Bahamas
12.1%
DIVORCED OR SEPARATED
37.7/ 100
METRIC RATING
187th/ 347
METRIC RANK
13.9%
DIVORCED OR SEPARATED
0.0/ 100
METRIC RATING
334th/ 347
METRIC RANK
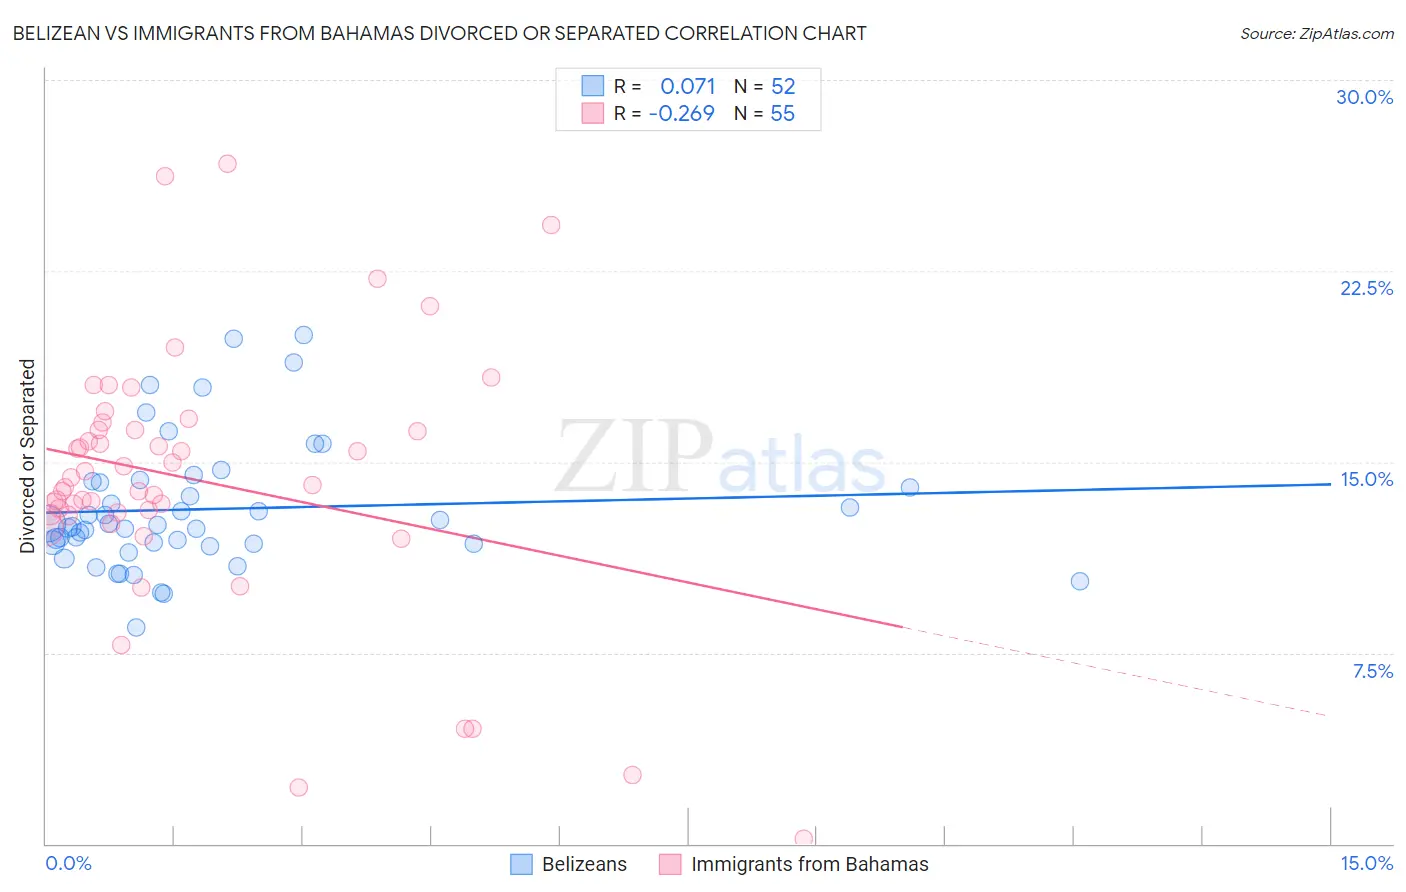
Belizean vs Immigrants from Bahamas Divorced or Separated Correlation Chart
The statistical analysis conducted on geographies consisting of 144,199,730 people shows a slight positive correlation between the proportion of Belizeans and percentage of population currently divorced or separated in the United States with a correlation coefficient (R) of 0.071 and weighted average of 12.1%. Similarly, the statistical analysis conducted on geographies consisting of 104,629,880 people shows a weak negative correlation between the proportion of Immigrants from Bahamas and percentage of population currently divorced or separated in the United States with a correlation coefficient (R) of -0.269 and weighted average of 13.9%, a difference of 14.9%.
Divorced or Separated Correlation Summary
| Measurement | Belizean | Immigrants from Bahamas |
| Minimum | 8.5% | 0.20% |
| Maximum | 20.0% | 26.7% |
| Range | 11.5% | 26.5% |
| Mean | 13.1% | 14.3% |
| Median | 12.5% | 14.1% |
| Interquartile 25% (IQ1) | 11.8% | 12.9% |
| Interquartile 75% (IQ3) | 14.2% | 16.3% |
| Interquartile Range (IQR) | 2.4% | 3.3% |
| Standard Deviation (Sample) | 2.5% | 5.1% |
| Standard Deviation (Population) | 2.5% | 5.1% |
Similar Demographics by Divorced or Separated
Demographics Similar to Belizeans by Divorced or Separated
In terms of divorced or separated, the demographic groups most similar to Belizeans are Immigrants from Belize (12.1%, a difference of 0.0%), Immigrants from Chile (12.1%, a difference of 0.050%), Sierra Leonean (12.1%, a difference of 0.080%), Immigrants from Nigeria (12.1%, a difference of 0.10%), and Moroccan (12.1%, a difference of 0.11%).
| Demographics | Rating | Rank | Divorced or Separated |
| Barbadians | 45.0 /100 | #180 | Average 12.1% |
| Immigrants | Canada | 44.0 /100 | #181 | Average 12.1% |
| Immigrants | Ethiopia | 43.1 /100 | #182 | Average 12.1% |
| Immigrants | Central America | 42.9 /100 | #183 | Average 12.1% |
| Immigrants | North America | 41.1 /100 | #184 | Average 12.1% |
| Immigrants | Nigeria | 40.5 /100 | #185 | Average 12.1% |
| Immigrants | Chile | 39.0 /100 | #186 | Fair 12.1% |
| Belizeans | 37.7 /100 | #187 | Fair 12.1% |
| Immigrants | Belize | 37.6 /100 | #188 | Fair 12.1% |
| Sierra Leoneans | 35.5 /100 | #189 | Fair 12.1% |
| Moroccans | 34.8 /100 | #190 | Fair 12.1% |
| Swedes | 34.4 /100 | #191 | Fair 12.1% |
| Norwegians | 33.2 /100 | #192 | Fair 12.1% |
| Immigrants | Thailand | 32.5 /100 | #193 | Fair 12.1% |
| Immigrants | Eritrea | 31.9 /100 | #194 | Fair 12.1% |
Demographics Similar to Immigrants from Bahamas by Divorced or Separated
In terms of divorced or separated, the demographic groups most similar to Immigrants from Bahamas are Puerto Rican (13.9%, a difference of 0.34%), Dutch West Indian (14.0%, a difference of 0.60%), Shoshone (14.0%, a difference of 0.95%), Crow (14.1%, a difference of 1.2%), and Cherokee (13.7%, a difference of 1.3%).
| Demographics | Rating | Rank | Divorced or Separated |
| Comanche | 0.0 /100 | #327 | Tragic 13.5% |
| Immigrants | Caribbean | 0.0 /100 | #328 | Tragic 13.6% |
| Houma | 0.0 /100 | #329 | Tragic 13.6% |
| Paiute | 0.0 /100 | #330 | Tragic 13.6% |
| Blacks/African Americans | 0.0 /100 | #331 | Tragic 13.6% |
| Cherokee | 0.0 /100 | #332 | Tragic 13.7% |
| Puerto Ricans | 0.0 /100 | #333 | Tragic 13.9% |
| Immigrants | Bahamas | 0.0 /100 | #334 | Tragic 13.9% |
| Dutch West Indians | 0.0 /100 | #335 | Tragic 14.0% |
| Shoshone | 0.0 /100 | #336 | Tragic 14.0% |
| Crow | 0.0 /100 | #337 | Tragic 14.1% |
| Choctaw | 0.0 /100 | #338 | Tragic 14.1% |
| Colville | 0.0 /100 | #339 | Tragic 14.2% |
| Chickasaw | 0.0 /100 | #340 | Tragic 14.2% |
| Bahamians | 0.0 /100 | #341 | Tragic 14.2% |