Lebanese vs Immigrants from Iraq Single Father Households
COMPARE
Lebanese
Immigrants from Iraq
Single Father Households
Single Father Households Comparison
Lebanese
Immigrants from Iraq
2.1%
SINGLE FATHER HOUSEHOLDS
98.9/ 100
METRIC RATING
103rd/ 347
METRIC RANK
2.2%
SINGLE FATHER HOUSEHOLDS
97.6/ 100
METRIC RATING
122nd/ 347
METRIC RANK
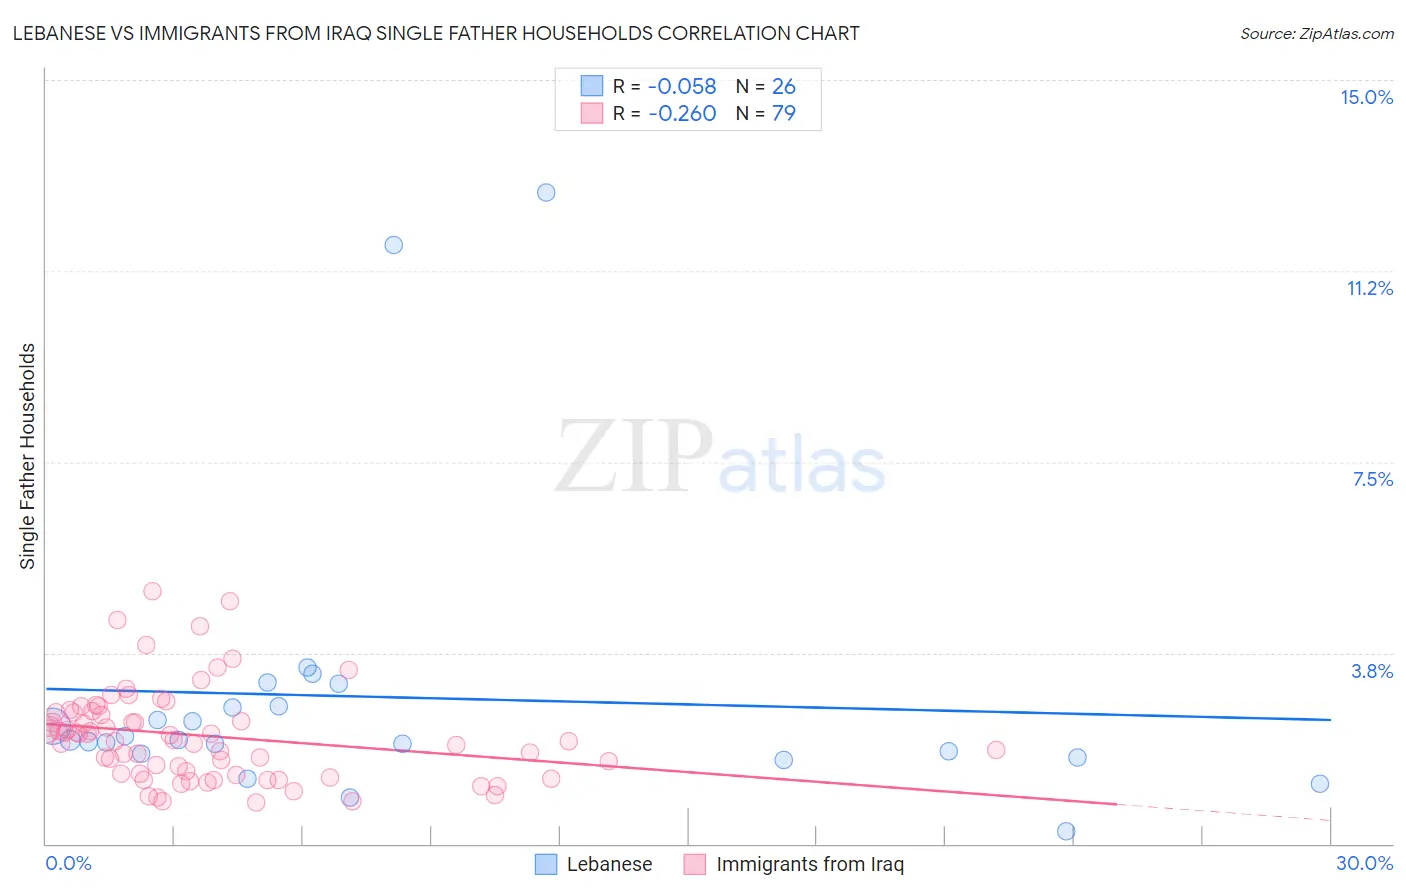
Lebanese vs Immigrants from Iraq Single Father Households Correlation Chart
The statistical analysis conducted on geographies consisting of 397,908,440 people shows a slight negative correlation between the proportion of Lebanese and percentage of single father households in the United States with a correlation coefficient (R) of -0.058 and weighted average of 2.1%. Similarly, the statistical analysis conducted on geographies consisting of 194,132,696 people shows a weak negative correlation between the proportion of Immigrants from Iraq and percentage of single father households in the United States with a correlation coefficient (R) of -0.260 and weighted average of 2.2%, a difference of 1.5%.
Single Father Households Correlation Summary
| Measurement | Lebanese | Immigrants from Iraq |
| Minimum | 0.25% | 0.80% |
| Maximum | 12.8% | 5.0% |
| Range | 12.5% | 4.2% |
| Mean | 2.9% | 2.1% |
| Median | 2.0% | 2.0% |
| Interquartile 25% (IQ1) | 1.8% | 1.4% |
| Interquartile 75% (IQ3) | 2.7% | 2.6% |
| Interquartile Range (IQR) | 0.94% | 1.2% |
| Standard Deviation (Sample) | 2.9% | 0.91% |
| Standard Deviation (Population) | 2.8% | 0.90% |
Demographics Similar to Lebanese and Immigrants from Iraq by Single Father Households
In terms of single father households, the demographic groups most similar to Lebanese are Argentinean (2.1%, a difference of 0.020%), Alsatian (2.1%, a difference of 0.020%), Palestinian (2.2%, a difference of 0.39%), Immigrants from Southern Europe (2.2%, a difference of 0.50%), and Slovene (2.2%, a difference of 0.62%). Similarly, the demographic groups most similar to Immigrants from Iraq are Australian (2.2%, a difference of 0.10%), Immigrants from Brazil (2.2%, a difference of 0.10%), Trinidadian and Tobagonian (2.2%, a difference of 0.13%), Immigrants from Morocco (2.2%, a difference of 0.19%), and Hungarian (2.2%, a difference of 0.29%).
| Demographics | Rating | Rank | Single Father Households |
| Argentineans | 98.9 /100 | #102 | Exceptional 2.1% |
| Lebanese | 98.9 /100 | #103 | Exceptional 2.1% |
| Alsatians | 98.9 /100 | #104 | Exceptional 2.1% |
| Palestinians | 98.6 /100 | #105 | Exceptional 2.2% |
| Immigrants | Southern Europe | 98.6 /100 | #106 | Exceptional 2.2% |
| Slovenes | 98.5 /100 | #107 | Exceptional 2.2% |
| Immigrants | Netherlands | 98.5 /100 | #108 | Exceptional 2.2% |
| Barbadians | 98.4 /100 | #109 | Exceptional 2.2% |
| Italians | 98.3 /100 | #110 | Exceptional 2.2% |
| Immigrants | Canada | 98.3 /100 | #111 | Exceptional 2.2% |
| Immigrants | Trinidad and Tobago | 98.2 /100 | #112 | Exceptional 2.2% |
| Iraqis | 98.2 /100 | #113 | Exceptional 2.2% |
| Immigrants | North America | 98.2 /100 | #114 | Exceptional 2.2% |
| Immigrants | Barbados | 98.2 /100 | #115 | Exceptional 2.2% |
| Immigrants | Argentina | 98.1 /100 | #116 | Exceptional 2.2% |
| Hungarians | 97.9 /100 | #117 | Exceptional 2.2% |
| Immigrants | Morocco | 97.8 /100 | #118 | Exceptional 2.2% |
| Trinidadians and Tobagonians | 97.8 /100 | #119 | Exceptional 2.2% |
| Australians | 97.7 /100 | #120 | Exceptional 2.2% |
| Immigrants | Brazil | 97.7 /100 | #121 | Exceptional 2.2% |
| Immigrants | Iraq | 97.6 /100 | #122 | Exceptional 2.2% |