Lebanese vs Immigrants from Eritrea Single Father Households
COMPARE
Lebanese
Immigrants from Eritrea
Single Father Households
Single Father Households Comparison
Lebanese
Immigrants from Eritrea
2.1%
SINGLE FATHER HOUSEHOLDS
98.9/ 100
METRIC RATING
103rd/ 347
METRIC RANK
2.5%
SINGLE FATHER HOUSEHOLDS
2.0/ 100
METRIC RATING
252nd/ 347
METRIC RANK
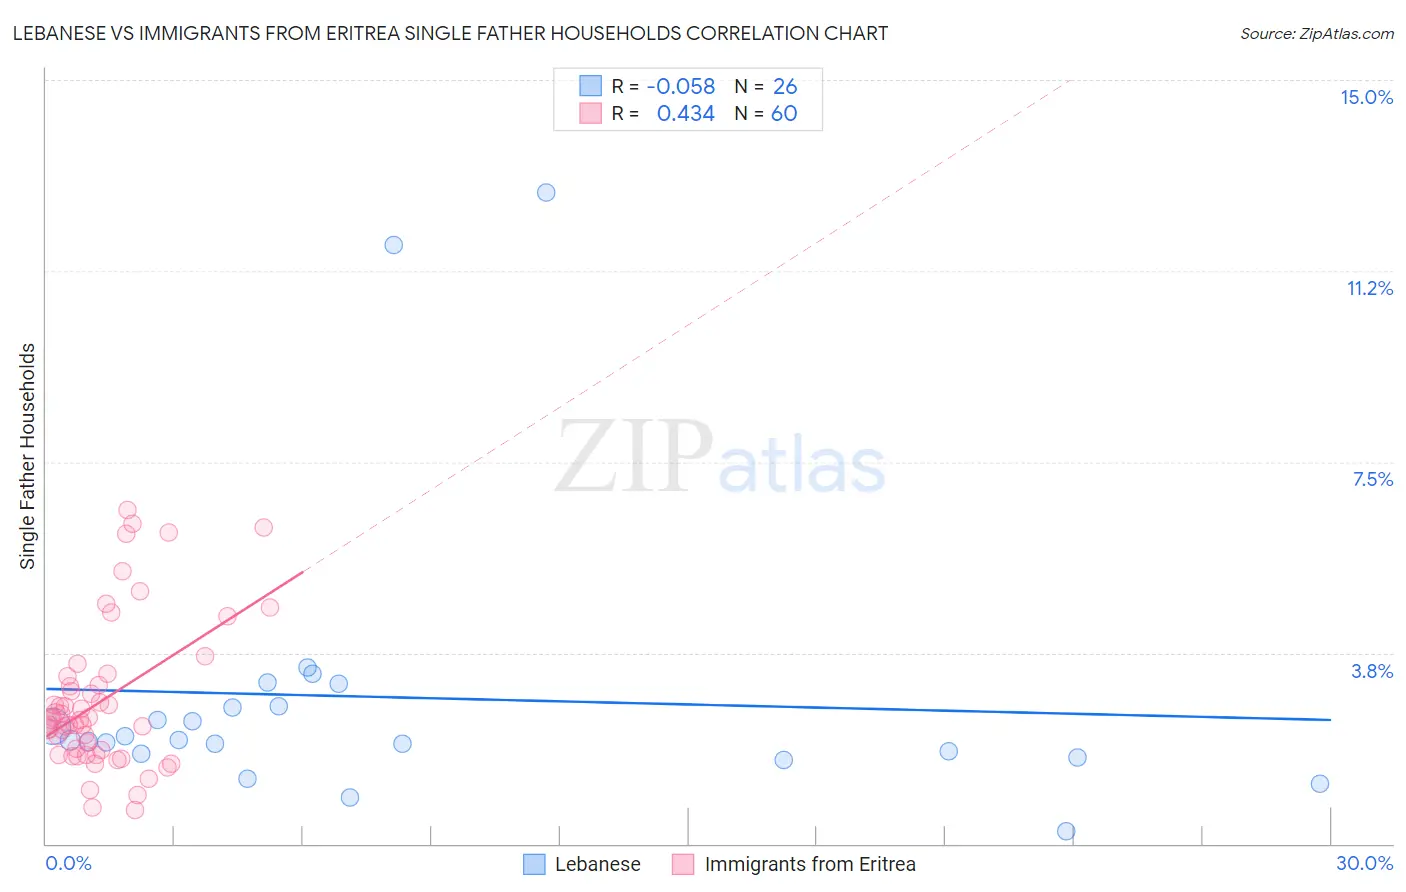
Lebanese vs Immigrants from Eritrea Single Father Households Correlation Chart
The statistical analysis conducted on geographies consisting of 397,908,440 people shows a slight negative correlation between the proportion of Lebanese and percentage of single father households in the United States with a correlation coefficient (R) of -0.058 and weighted average of 2.1%. Similarly, the statistical analysis conducted on geographies consisting of 104,791,168 people shows a moderate positive correlation between the proportion of Immigrants from Eritrea and percentage of single father households in the United States with a correlation coefficient (R) of 0.434 and weighted average of 2.5%, a difference of 16.8%.
Single Father Households Correlation Summary
| Measurement | Lebanese | Immigrants from Eritrea |
| Minimum | 0.25% | 0.67% |
| Maximum | 12.8% | 6.6% |
| Range | 12.5% | 5.9% |
| Mean | 2.9% | 2.8% |
| Median | 2.0% | 2.4% |
| Interquartile 25% (IQ1) | 1.8% | 1.8% |
| Interquartile 75% (IQ3) | 2.7% | 3.2% |
| Interquartile Range (IQR) | 0.94% | 1.4% |
| Standard Deviation (Sample) | 2.9% | 1.4% |
| Standard Deviation (Population) | 2.8% | 1.4% |
Similar Demographics by Single Father Households
Demographics Similar to Lebanese by Single Father Households
In terms of single father households, the demographic groups most similar to Lebanese are Argentinean (2.1%, a difference of 0.020%), Alsatian (2.1%, a difference of 0.020%), Immigrants from Western Europe (2.1%, a difference of 0.050%), Immigrants from Northern Africa (2.1%, a difference of 0.20%), and South African (2.1%, a difference of 0.35%).
| Demographics | Rating | Rank | Single Father Households |
| Arabs | 99.2 /100 | #96 | Exceptional 2.1% |
| Immigrants | Moldova | 99.1 /100 | #97 | Exceptional 2.1% |
| Guyanese | 99.1 /100 | #98 | Exceptional 2.1% |
| South Africans | 99.1 /100 | #99 | Exceptional 2.1% |
| Immigrants | Northern Africa | 99.0 /100 | #100 | Exceptional 2.1% |
| Immigrants | Western Europe | 98.9 /100 | #101 | Exceptional 2.1% |
| Argentineans | 98.9 /100 | #102 | Exceptional 2.1% |
| Lebanese | 98.9 /100 | #103 | Exceptional 2.1% |
| Alsatians | 98.9 /100 | #104 | Exceptional 2.1% |
| Palestinians | 98.6 /100 | #105 | Exceptional 2.2% |
| Immigrants | Southern Europe | 98.6 /100 | #106 | Exceptional 2.2% |
| Slovenes | 98.5 /100 | #107 | Exceptional 2.2% |
| Immigrants | Netherlands | 98.5 /100 | #108 | Exceptional 2.2% |
| Barbadians | 98.4 /100 | #109 | Exceptional 2.2% |
| Italians | 98.3 /100 | #110 | Exceptional 2.2% |
Demographics Similar to Immigrants from Eritrea by Single Father Households
In terms of single father households, the demographic groups most similar to Immigrants from Eritrea are Liberian (2.5%, a difference of 0.020%), Immigrants from Somalia (2.5%, a difference of 0.070%), Immigrants from Thailand (2.5%, a difference of 0.10%), Somali (2.5%, a difference of 0.11%), and Immigrants from Cameroon (2.5%, a difference of 0.28%).
| Demographics | Rating | Rank | Single Father Households |
| Basques | 2.5 /100 | #245 | Tragic 2.5% |
| Native Hawaiians | 2.5 /100 | #246 | Tragic 2.5% |
| Delaware | 2.5 /100 | #247 | Tragic 2.5% |
| Bahamians | 2.4 /100 | #248 | Tragic 2.5% |
| Immigrants | Cameroon | 2.3 /100 | #249 | Tragic 2.5% |
| Somalis | 2.1 /100 | #250 | Tragic 2.5% |
| Liberians | 2.0 /100 | #251 | Tragic 2.5% |
| Immigrants | Eritrea | 2.0 /100 | #252 | Tragic 2.5% |
| Immigrants | Somalia | 1.9 /100 | #253 | Tragic 2.5% |
| Immigrants | Thailand | 1.8 /100 | #254 | Tragic 2.5% |
| Tongans | 1.5 /100 | #255 | Tragic 2.5% |
| Potawatomi | 1.4 /100 | #256 | Tragic 2.5% |
| Immigrants | Congo | 1.2 /100 | #257 | Tragic 2.5% |
| Spanish | 1.1 /100 | #258 | Tragic 2.5% |
| Comanche | 1.0 /100 | #259 | Tragic 2.5% |