Lebanese vs Immigrants from Iraq Child Poverty Among Boys Under 16
COMPARE
Lebanese
Immigrants from Iraq
Child Poverty Among Boys Under 16
Child Poverty Among Boys Under 16 Comparison
Lebanese
Immigrants from Iraq
16.6%
CHILD POVERTY AMONG BOYS UNDER 16
43.3/ 100
METRIC RATING
182nd/ 347
METRIC RANK
17.0%
CHILD POVERTY AMONG BOYS UNDER 16
21.6/ 100
METRIC RATING
193rd/ 347
METRIC RANK
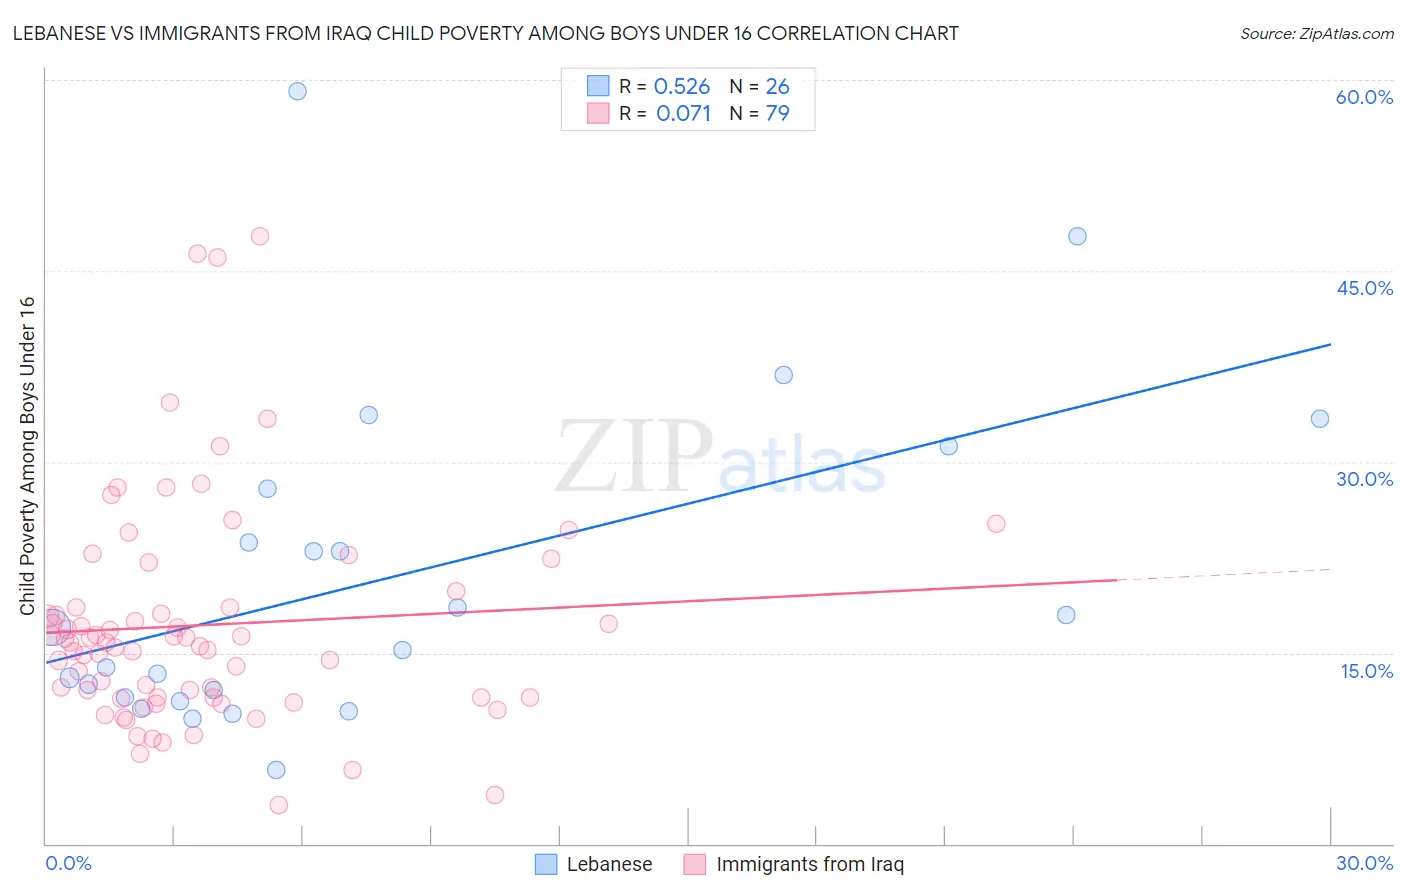
Lebanese vs Immigrants from Iraq Child Poverty Among Boys Under 16 Correlation Chart
The statistical analysis conducted on geographies consisting of 393,704,945 people shows a substantial positive correlation between the proportion of Lebanese and poverty level among boys under the age of 16 in the United States with a correlation coefficient (R) of 0.526 and weighted average of 16.6%. Similarly, the statistical analysis conducted on geographies consisting of 193,462,877 people shows a slight positive correlation between the proportion of Immigrants from Iraq and poverty level among boys under the age of 16 in the United States with a correlation coefficient (R) of 0.071 and weighted average of 17.0%, a difference of 2.8%.
Child Poverty Among Boys Under 16 Correlation Summary
| Measurement | Lebanese | Immigrants from Iraq |
| Minimum | 5.8% | 3.1% |
| Maximum | 59.1% | 47.7% |
| Range | 53.3% | 44.7% |
| Mean | 20.9% | 17.2% |
| Median | 16.1% | 15.8% |
| Interquartile 25% (IQ1) | 11.5% | 11.5% |
| Interquartile 75% (IQ3) | 27.9% | 18.6% |
| Interquartile Range (IQR) | 16.4% | 7.1% |
| Standard Deviation (Sample) | 12.9% | 8.7% |
| Standard Deviation (Population) | 12.7% | 8.7% |
Demographics Similar to Lebanese and Immigrants from Iraq by Child Poverty Among Boys Under 16
In terms of child poverty among boys under 16, the demographic groups most similar to Lebanese are South American Indian (16.5%, a difference of 0.11%), Hawaiian (16.5%, a difference of 0.25%), Kenyan (16.6%, a difference of 0.27%), Celtic (16.6%, a difference of 0.30%), and Immigrants from Western Asia (16.6%, a difference of 0.34%). Similarly, the demographic groups most similar to Immigrants from Iraq are Immigrants from Uganda (17.0%, a difference of 0.0%), Immigrants from Lebanon (17.0%, a difference of 0.060%), Spanish (17.0%, a difference of 0.14%), Spaniard (17.1%, a difference of 0.18%), and Immigrants from Kenya (17.1%, a difference of 0.24%).
| Demographics | Rating | Rank | Child Poverty Among Boys Under 16 |
| Ethiopians | 47.8 /100 | #177 | Average 16.5% |
| Scotch-Irish | 47.5 /100 | #178 | Average 16.5% |
| Hungarians | 47.3 /100 | #179 | Average 16.5% |
| Hawaiians | 45.5 /100 | #180 | Average 16.5% |
| South American Indians | 44.3 /100 | #181 | Average 16.5% |
| Lebanese | 43.3 /100 | #182 | Average 16.6% |
| Kenyans | 41.0 /100 | #183 | Average 16.6% |
| Celtics | 40.6 /100 | #184 | Average 16.6% |
| Immigrants | Western Asia | 40.4 /100 | #185 | Average 16.6% |
| Hmong | 38.4 /100 | #186 | Fair 16.6% |
| Immigrants | Costa Rica | 37.8 /100 | #187 | Fair 16.7% |
| Immigrants | South America | 37.7 /100 | #188 | Fair 16.7% |
| Immigrants | Morocco | 34.5 /100 | #189 | Fair 16.7% |
| Arabs | 31.1 /100 | #190 | Fair 16.8% |
| Alaska Natives | 29.8 /100 | #191 | Fair 16.8% |
| Immigrants | Uganda | 21.6 /100 | #192 | Fair 17.0% |
| Immigrants | Iraq | 21.6 /100 | #193 | Fair 17.0% |
| Immigrants | Lebanon | 21.2 /100 | #194 | Fair 17.0% |
| Spanish | 20.8 /100 | #195 | Fair 17.0% |
| Spaniards | 20.5 /100 | #196 | Fair 17.1% |
| Immigrants | Kenya | 20.1 /100 | #197 | Fair 17.1% |