Japanese vs Immigrants from Croatia Births to Unmarried Women

COMPARE

Japanese
Race
Ancestry
AfghanAfricanAlaska NativeAlaskan AthabascanAlbanianAleutAlsatianAmericanApacheArabArapahoArgentineanArmenianAssyrian/Chaldean/SyriacAustralianAustrianBahamianBangladeshiBarbadianBasqueBelgianBelizeanBermudanBhutaneseBlackfeetBolivianBrazilianBritishBritish West IndianBulgarianBurmeseCajunCambodianCanadianCape VerdeanCarpatho RusynCelticCentral AmericanCentral American IndianCherokeeCheyenneChickasawChileanChineseChippewaChoctawColombianColvilleComancheCosta RicanCreeCreekCroatianCrowCubanCypriotCzechCzechoslovakianDanishDelawareDominicanDutchDutch West IndianEastern EuropeanEcuadorianEgyptianEnglishEstonianEthiopianEuropeanFijianFilipinoFinnishFrenchFrench American IndianFrench CanadianGermanGerman RussianGhanaianGreekGuamanian/ChamorroGuatemalanGuyaneseHaitianHmongHonduranHopiHoumaHungarianIcelanderIndian (Asian)IndonesianInupiatIranianIraqiIrishIroquoisIsraeliItalianJamaicanJapaneseJordanianKenyanKiowaKoreanLaotianLatvianLebaneseLiberianLithuanianLumbeeLuxembourgerMacedonianMalaysianMalteseMarshalleseMenomineeMexicanMexican American IndianMongolianMoroccanNative HawaiianNavajoNepaleseNew ZealanderNicaraguanNigerianNorthern EuropeanNorwegianOkinawanOsageOttawaPaiutePakistaniPalestinianPanamanianParaguayanPennsylvania GermanPeruvianPimaPolishPortuguesePotawatomiPuebloPuerto RicanPuget Sound SalishRomanianRussianSalvadoranSamoanScandinavianScotch-IrishScottishSeminoleSenegaleseSerbianShoshoneSierra LeoneanSiouxSlavicSlovakSloveneSomaliSouth AfricanSouth AmericanSouth American IndianSoviet UnionSpaniardSpanishSpanish AmericanSpanish American IndianSri LankanSubsaharan AfricanSudaneseSwedishSwissSyrianTaiwaneseThaiTlingit-HaidaTohono O'OdhamTonganTrinidadian and TobagonianTsimshianTurkishU.S. Virgin IslanderUgandanUkrainianUruguayanUteVenezuelanVietnameseWelshWest IndianYakamaYaquiYugoslavianYumanYup'ikZimbabwean
Immigration
NonimmigrantsImmigrantsAfghanistanAfricaAlbaniaArgentinaArmeniaAsiaAustraliaAustriaBahamasBangladeshBarbadosBelarusBelgiumBelizeBoliviaBosnia and HerzegovinaBrazilBulgariaBurma/MyanmarCabo VerdeCambodiaCameroonCanadaCaribbeanCentral AmericaChileChinaColombiaCongoCosta RicaCubaCzechoslovakiaDenmarkDominicaDominican RepublicEastern AfricaEastern AsiaEastern EuropeEcuadorEgyptEl SalvadorEnglandEritreaEthiopiaEuropeFijiFranceGermanyGhanaGreeceGrenadaGuatemalaGuyanaHaitiHondurasHong KongHungaryIndiaIndonesiaIranIraqIrelandIsraelItalyJamaicaJapanJordanKazakhstanKenyaKoreaKuwaitLaosLatin AmericaLatviaLebanonLiberiaLithuaniaMalaysiaMexicoMicronesiaMiddle AfricaMoldovaMoroccoNepalNetherlandsNicaraguaNigeriaNorth AmericaNorth MacedoniaNorthern AfricaNorthern EuropeNorwayOceaniaPakistanPanamaPeruPhilippinesPolandPortugalRomaniaRussiaSaudi ArabiaScotlandSenegalSerbiaSierra LeoneSingaporeSomaliaSouth AfricaSouth AmericaSouth Central AsiaSouth Eastern AsiaSouthern EuropeSpainSri LankaSt. Vincent and the GrenadinesSudanSwedenSwitzerlandSyriaTaiwanThailandTrinidad and TobagoTurkeyUgandaUkraineUruguayUzbekistanVenezuelaVietnamWest IndiesWestern AfricaWestern AsiaWestern EuropeYemenZaireZimbabweAzores
Immigrants from Croatia
Race
Ancestry
AfghanAfricanAlaska NativeAlaskan AthabascanAlbanianAleutAlsatianAmericanApacheArabArapahoArgentineanArmenianAssyrian/Chaldean/SyriacAustralianAustrianBahamianBangladeshiBarbadianBasqueBelgianBelizeanBermudanBhutaneseBlackfeetBolivianBrazilianBritishBritish West IndianBulgarianBurmeseCajunCambodianCanadianCape VerdeanCarpatho RusynCelticCentral AmericanCentral American IndianCherokeeCheyenneChickasawChileanChineseChippewaChoctawColombianColvilleComancheCosta RicanCreeCreekCroatianCrowCubanCypriotCzechCzechoslovakianDanishDelawareDominicanDutchDutch West IndianEastern EuropeanEcuadorianEgyptianEnglishEstonianEthiopianEuropeanFijianFilipinoFinnishFrenchFrench American IndianFrench CanadianGermanGerman RussianGhanaianGreekGuamanian/ChamorroGuatemalanGuyaneseHaitianHmongHonduranHopiHoumaHungarianIcelanderIndian (Asian)IndonesianInupiatIranianIraqiIrishIroquoisIsraeliItalianJamaicanJordanianKenyanKiowaKoreanLaotianLatvianLebaneseLiberianLithuanianLumbeeLuxembourgerMacedonianMalaysianMalteseMarshalleseMenomineeMexicanMexican American IndianMongolianMoroccanNative HawaiianNavajoNepaleseNew ZealanderNicaraguanNigerianNorthern EuropeanNorwegianOkinawanOsageOttawaPaiutePakistaniPalestinianPanamanianParaguayanPennsylvania GermanPeruvianPimaPolishPortuguesePotawatomiPuebloPuerto RicanPuget Sound SalishRomanianRussianSalvadoranSamoanScandinavianScotch-IrishScottishSeminoleSenegaleseSerbianShoshoneSierra LeoneanSiouxSlavicSlovakSloveneSomaliSouth AfricanSouth AmericanSouth American IndianSoviet UnionSpaniardSpanishSpanish AmericanSpanish American IndianSri LankanSubsaharan AfricanSudaneseSwedishSwissSyrianTaiwaneseThaiTlingit-HaidaTohono O'OdhamTonganTrinidadian and TobagonianTsimshianTurkishU.S. Virgin IslanderUgandanUkrainianUruguayanUteVenezuelanVietnameseWelshWest IndianYakamaYaquiYugoslavianYumanYup'ikZimbabwean
Immigration
NonimmigrantsImmigrantsAfghanistanAfricaAlbaniaArgentinaArmeniaAsiaAustraliaAustriaBahamasBangladeshBarbadosBelarusBelgiumBelizeBoliviaBosnia and HerzegovinaBrazilBulgariaBurma/MyanmarCabo VerdeCambodiaCameroonCanadaCaribbeanCentral AmericaChileChinaColombiaCongoCosta RicaCroatiaCubaCzechoslovakiaDenmarkDominicaDominican RepublicEastern AfricaEastern AsiaEastern EuropeEcuadorEgyptEl SalvadorEnglandEritreaEthiopiaEuropeFijiFranceGermanyGhanaGreeceGrenadaGuatemalaGuyanaHaitiHondurasHong KongHungaryIndiaIndonesiaIranIraqIrelandIsraelItalyJamaicaJapanJordanKazakhstanKenyaKoreaKuwaitLaosLatin AmericaLatviaLebanonLiberiaLithuaniaMalaysiaMexicoMicronesiaMiddle AfricaMoldovaMoroccoNepalNetherlandsNicaraguaNigeriaNorth AmericaNorth MacedoniaNorthern AfricaNorthern EuropeNorwayOceaniaPakistanPanamaPeruPhilippinesPolandPortugalRomaniaRussiaSaudi ArabiaScotlandSenegalSerbiaSierra LeoneSingaporeSomaliaSouth AfricaSouth AmericaSouth Central AsiaSouth Eastern AsiaSouthern EuropeSpainSri LankaSt. Vincent and the GrenadinesSudanSwedenSwitzerlandSyriaTaiwanThailandTrinidad and TobagoTurkeyUgandaUkraineUruguayUzbekistanVenezuelaVietnamWest IndiesWestern AfricaWestern AsiaWestern EuropeYemenZaireZimbabweAzores
Births to Unmarried Women
Income
Poverty
Unemployment
Labor Participation
Family Structure
Vehicle Availability
Education Level
Disability

Births to Unmarried Women Comparison

Japanese

Immigrants from Croatia

Tragic
Exceptional
35.2%
BIRTHS TO UNMARRIED WOMEN
0.9/ 100
METRIC RATING
243rd/ 347
METRIC RANK
29.8%
BIRTHS TO UNMARRIED WOMEN
92.6/ 100
METRIC RATING
114th/ 347
METRIC RANK

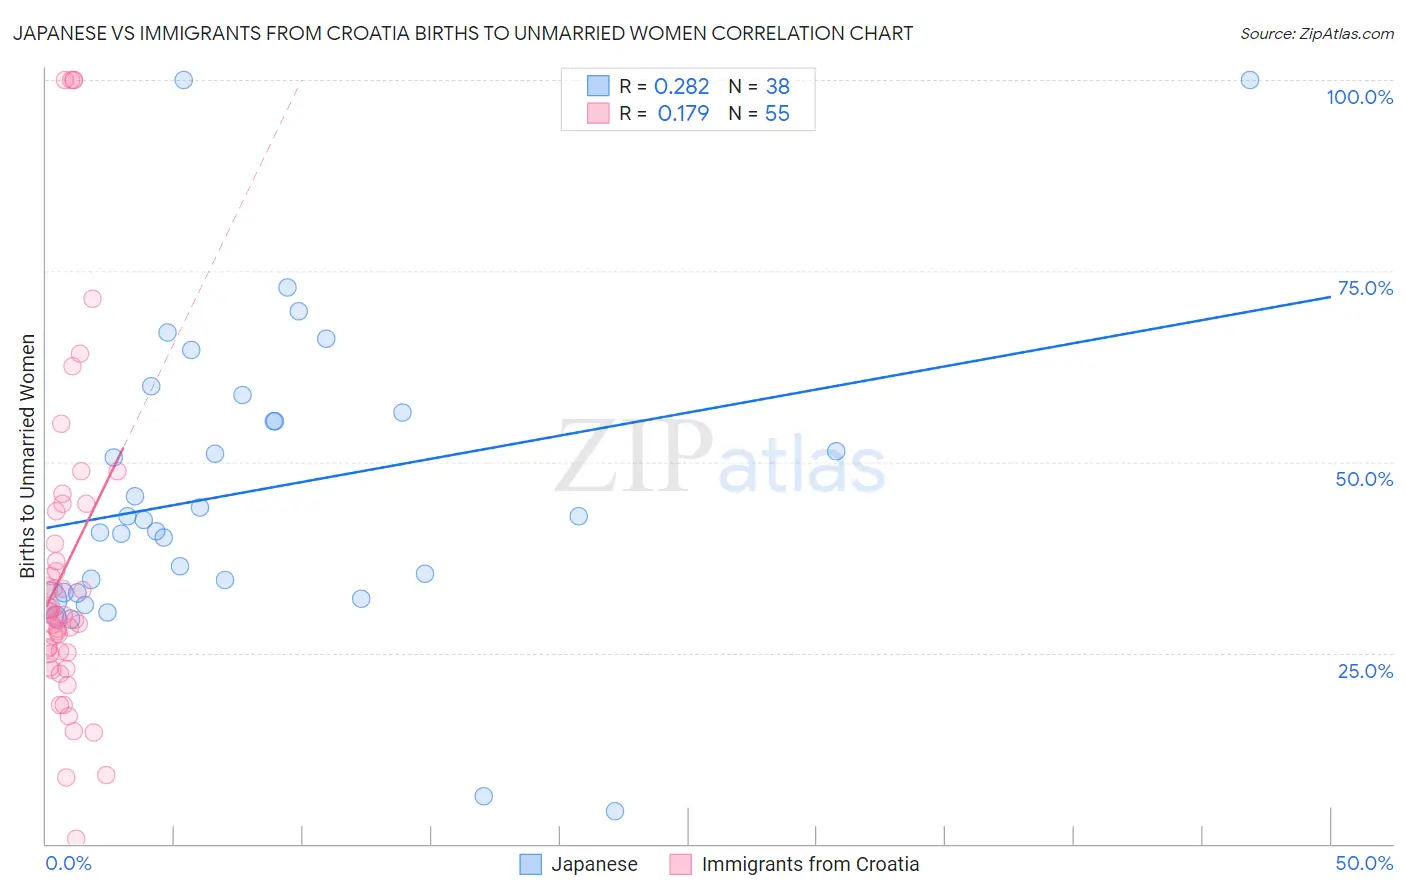
Japanese vs Immigrants from Croatia Births to Unmarried Women Correlation Chart

The statistical analysis conducted on geographies consisting of 240,312,984 people shows a weak positive correlation between the proportion of Japanese and percentage of births to unmarried women in the United States with a correlation coefficient (R) of 0.282 and weighted average of 35.2%. Similarly, the statistical analysis conducted on geographies consisting of 127,059,948 people shows a poor positive correlation between the proportion of Immigrants from Croatia and percentage of births to unmarried women in the United States with a correlation coefficient (R) of 0.179 and weighted average of 29.8%, a difference of 18.0%.
Japanese vs Immigrants from Croatia Births to Unmarried Women

Births to Unmarried Women Correlation Summary

MeasurementJapaneseImmigrants from Croatia
Minimum4.3%0.70%
Maximum100.0%100.0%
Range95.7%99.3%
Mean46.3%36.1%
Median42.6%29.8%
Interquartile 25% (IQ1)32.9%24.9%
Interquartile 75% (IQ3)56.4%43.5%
Interquartile Range (IQR)23.5%18.6%
Standard Deviation (Sample)19.9%22.4%
Standard Deviation (Population)19.7%22.2%

Similar Demographics by Births to Unmarried Women

Demographics Similar to Japanese by Births to Unmarried Women

In terms of births to unmarried women, the demographic groups most similar to Japanese are Guyanese (35.2%, a difference of 0.060%), Shoshone (35.3%, a difference of 0.40%), Indonesian (35.0%, a difference of 0.49%), Nigerian (35.3%, a difference of 0.51%), and Immigrants from Guyana (35.0%, a difference of 0.59%).
DemographicsRating | RankBirths to Unmarried Women
Immigrants | Cameroon
1.6
/100
|
#236
Tragic
34.7%
Marshallese
1.6
/100
|
#237
Tragic
34.8%
Immigrants | Cambodia
1.6
/100
|
#238
Tragic
34.8%
Sierra Leoneans
1.4
/100
|
#239
Tragic
34.9%
Immigrants | Middle Africa
1.2
/100
|
#240
Tragic
34.9%
Immigrants | Guyana
1.2
/100
|
#241
Tragic
35.0%
Indonesians
1.2
/100
|
#242
Tragic
35.0%
Japanese
0.9
/100
|
#243
Tragic
35.2%
Guyanese
0.9
/100
|
#244
Tragic
35.2%
Shoshone
0.8
/100
|
#245
Tragic
35.3%
Nigerians
0.7
/100
|
#246
Tragic
35.3%
Immigrants | Nigeria
0.7
/100
|
#247
Tragic
35.4%
Immigrants | Nonimmigrants
0.6
/100
|
#248
Tragic
35.5%
Bermudans
0.6
/100
|
#249
Tragic
35.5%
Mexican American Indians
0.4
/100
|
#250
Tragic
35.7%

Demographics Similar to Immigrants from Croatia by Births to Unmarried Women

In terms of births to unmarried women, the demographic groups most similar to Immigrants from Croatia are Scandinavian (29.8%, a difference of 0.060%), Basque (29.7%, a difference of 0.16%), Immigrants from Hungary (29.7%, a difference of 0.17%), Ethiopian (29.8%, a difference of 0.22%), and Immigrants from Italy (29.9%, a difference of 0.30%).
DemographicsRating | RankBirths to Unmarried Women
Immigrants | Brazil
93.7
/100
|
#107
Exceptional
29.6%
Paraguayans
93.5
/100
|
#108
Exceptional
29.7%
Greeks
93.4
/100
|
#109
Exceptional
29.7%
Immigrants | Ethiopia
93.4
/100
|
#110
Exceptional
29.7%
Immigrants | Hungary
93.0
/100
|
#111
Exceptional
29.7%
Basques
93.0
/100
|
#112
Exceptional
29.7%
Scandinavians
92.7
/100
|
#113
Exceptional
29.8%
Immigrants | Croatia
92.6
/100
|
#114
Exceptional
29.8%
Ethiopians
91.9
/100
|
#115
Exceptional
29.8%
Immigrants | Italy
91.7
/100
|
#116
Exceptional
29.9%
Immigrants | Netherlands
91.1
/100
|
#117
Exceptional
29.9%
Immigrants | Norway
91.0
/100
|
#118
Exceptional
29.9%
Argentineans
90.5
/100
|
#119
Exceptional
30.0%
Ugandans
89.2
/100
|
#120
Excellent
30.1%
Koreans
88.9
/100
|
#121
Excellent
30.1%