Immigrants from Ukraine vs Immigrants from Scotland Family Households with Children

COMPARE

Immigrants from Ukraine
Race
Ancestry
AfghanAfricanAlaska NativeAlaskan AthabascanAlbanianAleutAlsatianAmericanApacheArabArapahoArgentineanArmenianAssyrian/Chaldean/SyriacAustralianAustrianBahamianBangladeshiBarbadianBasqueBelgianBelizeanBermudanBhutaneseBlackfeetBolivianBrazilianBritishBritish West IndianBulgarianBurmeseCajunCambodianCanadianCape VerdeanCarpatho RusynCelticCentral AmericanCentral American IndianCherokeeCheyenneChickasawChileanChineseChippewaChoctawColombianColvilleComancheCosta RicanCreeCreekCroatianCrowCubanCypriotCzechCzechoslovakianDanishDelawareDominicanDutchDutch West IndianEastern EuropeanEcuadorianEgyptianEnglishEstonianEthiopianEuropeanFijianFilipinoFinnishFrenchFrench American IndianFrench CanadianGermanGerman RussianGhanaianGreekGuamanian/ChamorroGuatemalanGuyaneseHaitianHmongHonduranHopiHoumaHungarianIcelanderIndian (Asian)IndonesianInupiatIranianIraqiIrishIroquoisIsraeliItalianJamaicanJapaneseJordanianKenyanKiowaKoreanLaotianLatvianLebaneseLiberianLithuanianLumbeeLuxembourgerMacedonianMalaysianMalteseMarshalleseMenomineeMexicanMexican American IndianMongolianMoroccanNative HawaiianNavajoNepaleseNew ZealanderNicaraguanNigerianNorthern EuropeanNorwegianOkinawanOsageOttawaPaiutePakistaniPalestinianPanamanianParaguayanPennsylvania GermanPeruvianPimaPolishPortuguesePotawatomiPuebloPuerto RicanPuget Sound SalishRomanianRussianSalvadoranSamoanScandinavianScotch-IrishScottishSeminoleSenegaleseSerbianShoshoneSierra LeoneanSiouxSlavicSlovakSloveneSomaliSouth AfricanSouth AmericanSouth American IndianSoviet UnionSpaniardSpanishSpanish AmericanSpanish American IndianSri LankanSubsaharan AfricanSudaneseSwedishSwissSyrianTaiwaneseThaiTlingit-HaidaTohono O'OdhamTonganTrinidadian and TobagonianTsimshianTurkishU.S. Virgin IslanderUgandanUkrainianUruguayanUteVenezuelanVietnameseWelshWest IndianYakamaYaquiYugoslavianYumanYup'ikZimbabwean
Immigration
NonimmigrantsImmigrantsAfghanistanAfricaAlbaniaArgentinaArmeniaAsiaAustraliaAustriaBahamasBangladeshBarbadosBelarusBelgiumBelizeBoliviaBosnia and HerzegovinaBrazilBulgariaBurma/MyanmarCabo VerdeCambodiaCameroonCanadaCaribbeanCentral AmericaChileChinaColombiaCongoCosta RicaCroatiaCubaCzechoslovakiaDenmarkDominicaDominican RepublicEastern AfricaEastern AsiaEastern EuropeEcuadorEgyptEl SalvadorEnglandEritreaEthiopiaEuropeFijiFranceGermanyGhanaGreeceGrenadaGuatemalaGuyanaHaitiHondurasHong KongHungaryIndiaIndonesiaIranIraqIrelandIsraelItalyJamaicaJapanJordanKazakhstanKenyaKoreaKuwaitLaosLatin AmericaLatviaLebanonLiberiaLithuaniaMalaysiaMexicoMicronesiaMiddle AfricaMoldovaMoroccoNepalNetherlandsNicaraguaNigeriaNorth AmericaNorth MacedoniaNorthern AfricaNorthern EuropeNorwayOceaniaPakistanPanamaPeruPhilippinesPolandPortugalRomaniaRussiaSaudi ArabiaSenegalSerbiaSierra LeoneSingaporeSomaliaSouth AfricaSouth AmericaSouth Central AsiaSouth Eastern AsiaSouthern EuropeSpainSri LankaSt. Vincent and the GrenadinesSudanSwedenSwitzerlandSyriaTaiwanThailandTrinidad and TobagoTurkeyUgandaUkraineUruguayUzbekistanVenezuelaVietnamWest IndiesWestern AfricaWestern AsiaWestern EuropeYemenZaireZimbabweAzores
Immigrants from Scotland
Race
Ancestry
AfghanAfricanAlaska NativeAlaskan AthabascanAlbanianAleutAlsatianAmericanApacheArabArapahoArgentineanArmenianAssyrian/Chaldean/SyriacAustralianAustrianBahamianBangladeshiBarbadianBasqueBelgianBelizeanBermudanBhutaneseBlackfeetBolivianBrazilianBritishBritish West IndianBulgarianBurmeseCajunCambodianCanadianCape VerdeanCarpatho RusynCelticCentral AmericanCentral American IndianCherokeeCheyenneChickasawChileanChineseChippewaChoctawColombianColvilleComancheCosta RicanCreeCreekCroatianCrowCubanCypriotCzechCzechoslovakianDanishDelawareDominicanDutchDutch West IndianEastern EuropeanEcuadorianEgyptianEnglishEstonianEthiopianEuropeanFijianFilipinoFinnishFrenchFrench American IndianFrench CanadianGermanGerman RussianGhanaianGreekGuamanian/ChamorroGuatemalanGuyaneseHaitianHmongHonduranHopiHoumaHungarianIcelanderIndian (Asian)IndonesianInupiatIranianIraqiIrishIroquoisIsraeliItalianJamaicanJapaneseJordanianKenyanKiowaKoreanLaotianLatvianLebaneseLiberianLithuanianLumbeeLuxembourgerMacedonianMalaysianMalteseMarshalleseMenomineeMexicanMexican American IndianMongolianMoroccanNative HawaiianNavajoNepaleseNew ZealanderNicaraguanNigerianNorthern EuropeanNorwegianOkinawanOsageOttawaPaiutePakistaniPalestinianPanamanianParaguayanPennsylvania GermanPeruvianPimaPolishPortuguesePotawatomiPuebloPuerto RicanPuget Sound SalishRomanianRussianSalvadoranSamoanScandinavianScotch-IrishScottishSeminoleSenegaleseSerbianShoshoneSierra LeoneanSiouxSlavicSlovakSloveneSomaliSouth AfricanSouth AmericanSouth American IndianSoviet UnionSpaniardSpanishSpanish AmericanSpanish American IndianSri LankanSubsaharan AfricanSudaneseSwedishSwissSyrianTaiwaneseThaiTlingit-HaidaTohono O'OdhamTonganTrinidadian and TobagonianTsimshianTurkishU.S. Virgin IslanderUgandanUkrainianUruguayanUteVenezuelanVietnameseWelshWest IndianYakamaYaquiYugoslavianYumanYup'ikZimbabwean
Immigration
NonimmigrantsImmigrantsAfghanistanAfricaAlbaniaArgentinaArmeniaAsiaAustraliaAustriaBahamasBangladeshBarbadosBelarusBelgiumBelizeBoliviaBosnia and HerzegovinaBrazilBulgariaBurma/MyanmarCabo VerdeCambodiaCameroonCanadaCaribbeanCentral AmericaChileChinaColombiaCongoCosta RicaCroatiaCubaCzechoslovakiaDenmarkDominicaDominican RepublicEastern AfricaEastern AsiaEastern EuropeEcuadorEgyptEl SalvadorEnglandEritreaEthiopiaEuropeFijiFranceGermanyGhanaGreeceGrenadaGuatemalaGuyanaHaitiHondurasHong KongHungaryIndiaIndonesiaIranIraqIrelandIsraelItalyJamaicaJapanJordanKazakhstanKenyaKoreaKuwaitLaosLatin AmericaLatviaLebanonLiberiaLithuaniaMalaysiaMexicoMicronesiaMiddle AfricaMoldovaMoroccoNepalNetherlandsNicaraguaNigeriaNorth AmericaNorth MacedoniaNorthern AfricaNorthern EuropeNorwayOceaniaPakistanPanamaPeruPhilippinesPolandPortugalRomaniaRussiaSaudi ArabiaScotlandSenegalSerbiaSierra LeoneSingaporeSomaliaSouth AfricaSouth AmericaSouth Central AsiaSouth Eastern AsiaSouthern EuropeSpainSri LankaSt. Vincent and the GrenadinesSudanSwedenSwitzerlandSyriaTaiwanThailandTrinidad and TobagoTurkeyUgandaUruguayUzbekistanVenezuelaVietnamWest IndiesWestern AfricaWestern AsiaWestern EuropeYemenZaireZimbabweAzores
Family Households with Children
Income
Poverty
Unemployment
Labor Participation
Family Structure
Vehicle Availability
Education Level
Disability

Family Households with Children Comparison

Immigrants from Ukraine

Immigrants from Scotland

Poor
Tragic
27.2%
FAMILY HOUSEHOLDS WITH CHILDREN
14.4/ 100
METRIC RATING
210th/ 347
METRIC RANK
26.8%
FAMILY HOUSEHOLDS WITH CHILDREN
1.5/ 100
METRIC RATING
254th/ 347
METRIC RANK

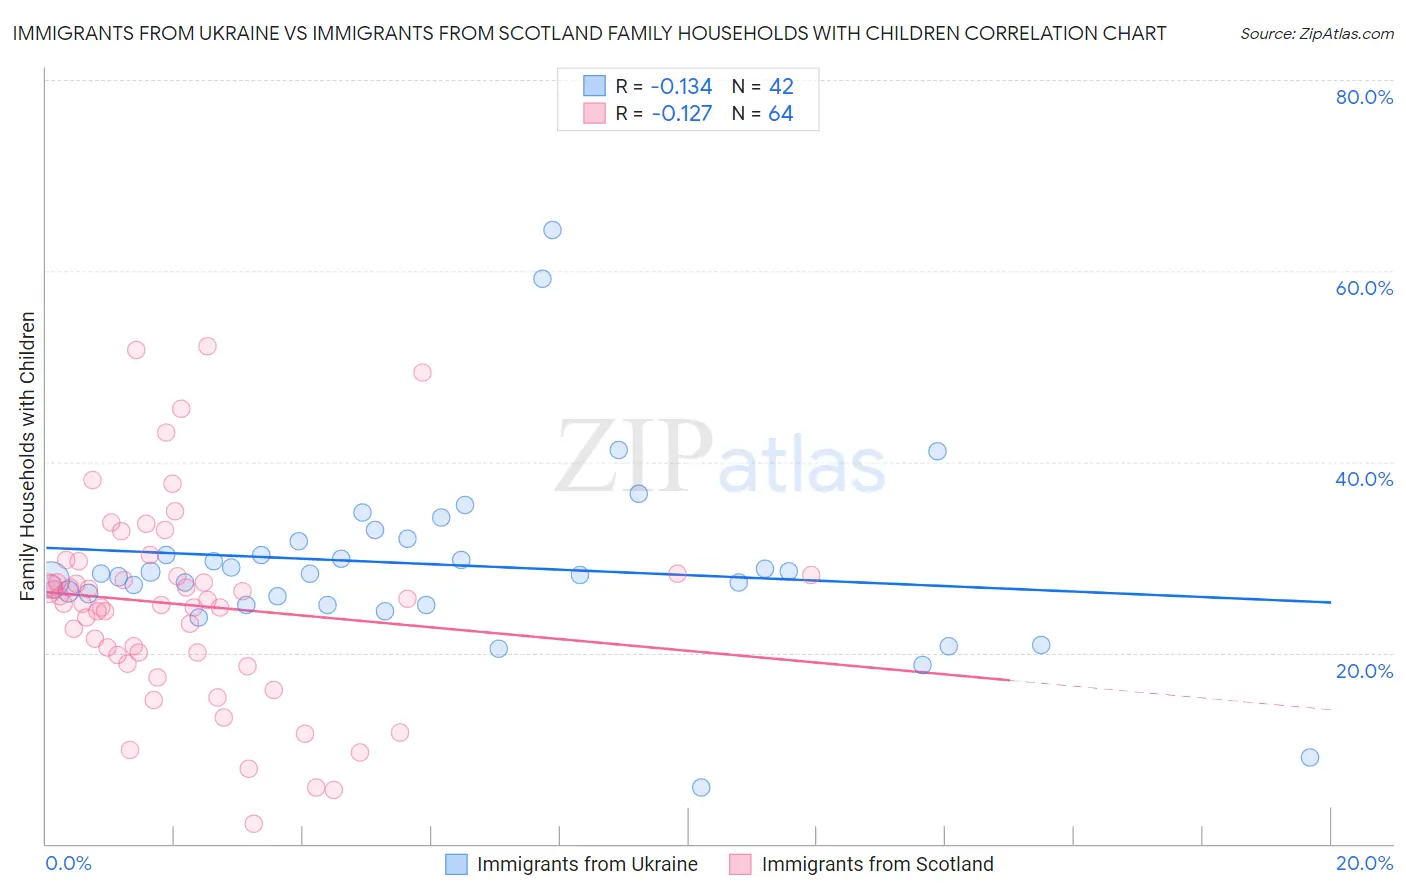
Immigrants from Ukraine vs Immigrants from Scotland Family Households with Children Correlation Chart

The statistical analysis conducted on geographies consisting of 289,589,077 people shows a poor negative correlation between the proportion of Immigrants from Ukraine and percentage of family households with children in the United States with a correlation coefficient (R) of -0.134 and weighted average of 27.2%. Similarly, the statistical analysis conducted on geographies consisting of 196,363,722 people shows a poor negative correlation between the proportion of Immigrants from Scotland and percentage of family households with children in the United States with a correlation coefficient (R) of -0.127 and weighted average of 26.8%, a difference of 1.4%.
Immigrants from Ukraine vs Immigrants from Scotland Family Households with Children

Family Households with Children Correlation Summary

MeasurementImmigrants from UkraineImmigrants from Scotland
Minimum5.9%2.1%
Maximum64.3%52.1%
Range58.4%50.1%
Mean29.2%25.0%
Median28.3%25.4%
Interquartile 25% (IQ1)25.0%19.9%
Interquartile 75% (IQ3)31.7%28.3%
Interquartile Range (IQR)6.7%8.4%
Standard Deviation (Sample)9.9%10.3%
Standard Deviation (Population)9.8%10.2%

Similar Demographics by Family Households with Children

Demographics Similar to Immigrants from Ukraine by Family Households with Children

In terms of family households with children, the demographic groups most similar to Immigrants from Ukraine are Welsh (27.2%, a difference of 0.010%), Immigrants from Dominica (27.2%, a difference of 0.020%), Okinawan (27.2%, a difference of 0.030%), Dutch West Indian (27.2%, a difference of 0.060%), and African (27.2%, a difference of 0.070%).
DemographicsRating | RankFamily Households with Children
Kiowa
22.2
/100
|
#203
Fair
27.3%
Immigrants | Sudan
21.6
/100
|
#204
Fair
27.3%
Immigrants | Haiti
20.3
/100
|
#205
Fair
27.2%
Immigrants | Micronesia
20.2
/100
|
#206
Fair
27.2%
Haitians
19.8
/100
|
#207
Poor
27.2%
Immigrants | Poland
16.4
/100
|
#208
Poor
27.2%
Dutch West Indians
15.8
/100
|
#209
Poor
27.2%
Immigrants | Ukraine
14.4
/100
|
#210
Poor
27.2%
Welsh
14.2
/100
|
#211
Poor
27.2%
Immigrants | Dominica
13.9
/100
|
#212
Poor
27.2%
Okinawans
13.7
/100
|
#213
Poor
27.2%
Africans
13.0
/100
|
#214
Poor
27.2%
Northern Europeans
12.8
/100
|
#215
Poor
27.2%
Cubans
12.2
/100
|
#216
Poor
27.1%
U.S. Virgin Islanders
12.1
/100
|
#217
Poor
27.1%

Demographics Similar to Immigrants from Scotland by Family Households with Children

In terms of family households with children, the demographic groups most similar to Immigrants from Scotland are German Russian (26.8%, a difference of 0.0%), Scotch-Irish (26.8%, a difference of 0.020%), Italian (26.8%, a difference of 0.030%), Slavic (26.8%, a difference of 0.070%), and Immigrants from Cuba (26.8%, a difference of 0.070%).
DemographicsRating | RankFamily Households with Children
Potawatomi
2.2
/100
|
#247
Tragic
26.9%
Immigrants | Kazakhstan
2.2
/100
|
#248
Tragic
26.9%
Immigrants | Eastern Europe
2.1
/100
|
#249
Tragic
26.9%
Belgians
2.1
/100
|
#250
Tragic
26.9%
Immigrants | Bosnia and Herzegovina
1.9
/100
|
#251
Tragic
26.8%
Irish
1.8
/100
|
#252
Tragic
26.8%
Italians
1.5
/100
|
#253
Tragic
26.8%
Immigrants | Scotland
1.5
/100
|
#254
Tragic
26.8%
German Russians
1.5
/100
|
#255
Tragic
26.8%
Scotch-Irish
1.4
/100
|
#256
Tragic
26.8%
Slavs
1.3
/100
|
#257
Tragic
26.8%
Immigrants | Cuba
1.3
/100
|
#258
Tragic
26.8%
Immigrants | Lithuania
1.2
/100
|
#259
Tragic
26.8%
Immigrants | Jamaica
1.2
/100
|
#260
Tragic
26.8%
Immigrants | Belarus
1.1
/100
|
#261
Tragic
26.8%