Immigrants from Ukraine vs Immigrants from Jamaica Family Households with Children
COMPARE
Immigrants from Ukraine
Immigrants from Jamaica
Family Households with Children
Family Households with Children Comparison
Immigrants from Ukraine
Immigrants from Jamaica
27.2%
FAMILY HOUSEHOLDS WITH CHILDREN
14.4/ 100
METRIC RATING
210th/ 347
METRIC RANK
26.8%
FAMILY HOUSEHOLDS WITH CHILDREN
1.2/ 100
METRIC RATING
260th/ 347
METRIC RANK
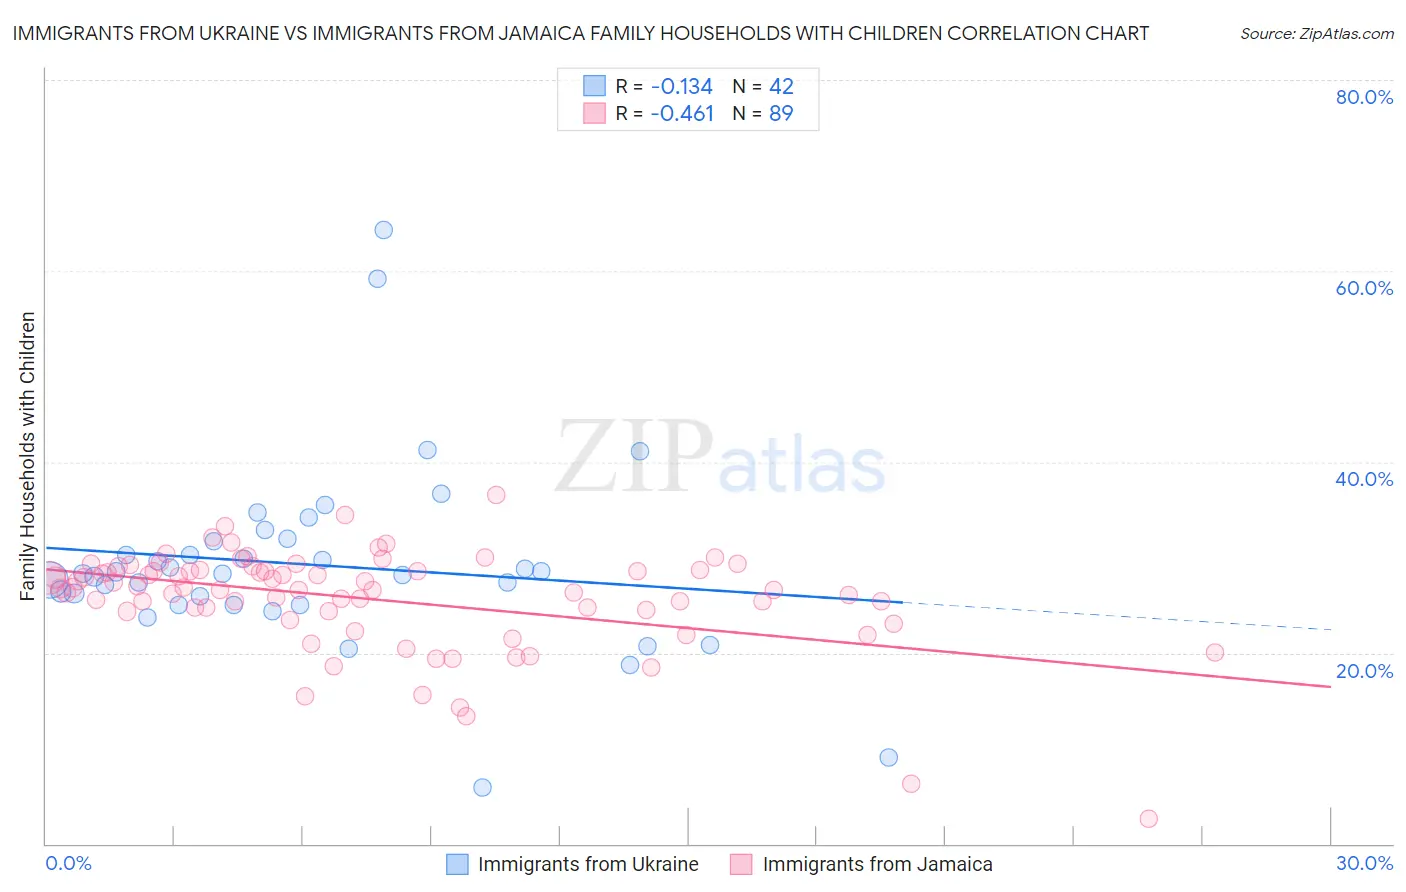
Immigrants from Ukraine vs Immigrants from Jamaica Family Households with Children Correlation Chart
The statistical analysis conducted on geographies consisting of 289,589,077 people shows a poor negative correlation between the proportion of Immigrants from Ukraine and percentage of family households with children in the United States with a correlation coefficient (R) of -0.134 and weighted average of 27.2%. Similarly, the statistical analysis conducted on geographies consisting of 301,520,454 people shows a moderate negative correlation between the proportion of Immigrants from Jamaica and percentage of family households with children in the United States with a correlation coefficient (R) of -0.461 and weighted average of 26.8%, a difference of 1.5%.
Family Households with Children Correlation Summary
| Measurement | Immigrants from Ukraine | Immigrants from Jamaica |
| Minimum | 5.9% | 2.7% |
| Maximum | 64.3% | 36.6% |
| Range | 58.4% | 33.9% |
| Mean | 29.2% | 25.6% |
| Median | 28.3% | 26.7% |
| Interquartile 25% (IQ1) | 25.0% | 24.3% |
| Interquartile 75% (IQ3) | 31.7% | 28.6% |
| Interquartile Range (IQR) | 6.7% | 4.3% |
| Standard Deviation (Sample) | 9.9% | 5.4% |
| Standard Deviation (Population) | 9.8% | 5.4% |
Similar Demographics by Family Households with Children
Demographics Similar to Immigrants from Ukraine by Family Households with Children
In terms of family households with children, the demographic groups most similar to Immigrants from Ukraine are Welsh (27.2%, a difference of 0.010%), Immigrants from Dominica (27.2%, a difference of 0.020%), Okinawan (27.2%, a difference of 0.030%), Dutch West Indian (27.2%, a difference of 0.060%), and African (27.2%, a difference of 0.070%).
| Demographics | Rating | Rank | Family Households with Children |
| Kiowa | 22.2 /100 | #203 | Fair 27.3% |
| Immigrants | Sudan | 21.6 /100 | #204 | Fair 27.3% |
| Immigrants | Haiti | 20.3 /100 | #205 | Fair 27.2% |
| Immigrants | Micronesia | 20.2 /100 | #206 | Fair 27.2% |
| Haitians | 19.8 /100 | #207 | Poor 27.2% |
| Immigrants | Poland | 16.4 /100 | #208 | Poor 27.2% |
| Dutch West Indians | 15.8 /100 | #209 | Poor 27.2% |
| Immigrants | Ukraine | 14.4 /100 | #210 | Poor 27.2% |
| Welsh | 14.2 /100 | #211 | Poor 27.2% |
| Immigrants | Dominica | 13.9 /100 | #212 | Poor 27.2% |
| Okinawans | 13.7 /100 | #213 | Poor 27.2% |
| Africans | 13.0 /100 | #214 | Poor 27.2% |
| Northern Europeans | 12.8 /100 | #215 | Poor 27.2% |
| Cubans | 12.2 /100 | #216 | Poor 27.1% |
| U.S. Virgin Islanders | 12.1 /100 | #217 | Poor 27.1% |
Demographics Similar to Immigrants from Jamaica by Family Households with Children
In terms of family households with children, the demographic groups most similar to Immigrants from Jamaica are Immigrants from Lithuania (26.8%, a difference of 0.020%), Slavic (26.8%, a difference of 0.050%), Immigrants from Cuba (26.8%, a difference of 0.050%), Immigrants from Belarus (26.8%, a difference of 0.060%), and Scotch-Irish (26.8%, a difference of 0.10%).
| Demographics | Rating | Rank | Family Households with Children |
| Italians | 1.5 /100 | #253 | Tragic 26.8% |
| Immigrants | Scotland | 1.5 /100 | #254 | Tragic 26.8% |
| German Russians | 1.5 /100 | #255 | Tragic 26.8% |
| Scotch-Irish | 1.4 /100 | #256 | Tragic 26.8% |
| Slavs | 1.3 /100 | #257 | Tragic 26.8% |
| Immigrants | Cuba | 1.3 /100 | #258 | Tragic 26.8% |
| Immigrants | Lithuania | 1.2 /100 | #259 | Tragic 26.8% |
| Immigrants | Jamaica | 1.2 /100 | #260 | Tragic 26.8% |
| Immigrants | Belarus | 1.1 /100 | #261 | Tragic 26.8% |
| Immigrants | Russia | 1.0 /100 | #262 | Tragic 26.8% |
| Immigrants | North Macedonia | 1.0 /100 | #263 | Tragic 26.7% |
| Taiwanese | 0.9 /100 | #264 | Tragic 26.7% |
| Chippewa | 0.9 /100 | #265 | Tragic 26.7% |
| Maltese | 0.9 /100 | #266 | Tragic 26.7% |
| Immigrants | Uzbekistan | 0.9 /100 | #267 | Tragic 26.7% |