Immigrants from Spain vs Luxembourger Births to Unmarried Women
COMPARE
Immigrants from Spain
Luxembourger
Births to Unmarried Women
Births to Unmarried Women Comparison
Immigrants from Spain
Luxembourgers
30.3%
BIRTHS TO UNMARRIED WOMEN
85.8/ 100
METRIC RATING
129th/ 347
METRIC RANK
29.4%
BIRTHS TO UNMARRIED WOMEN
95.2/ 100
METRIC RATING
100th/ 347
METRIC RANK
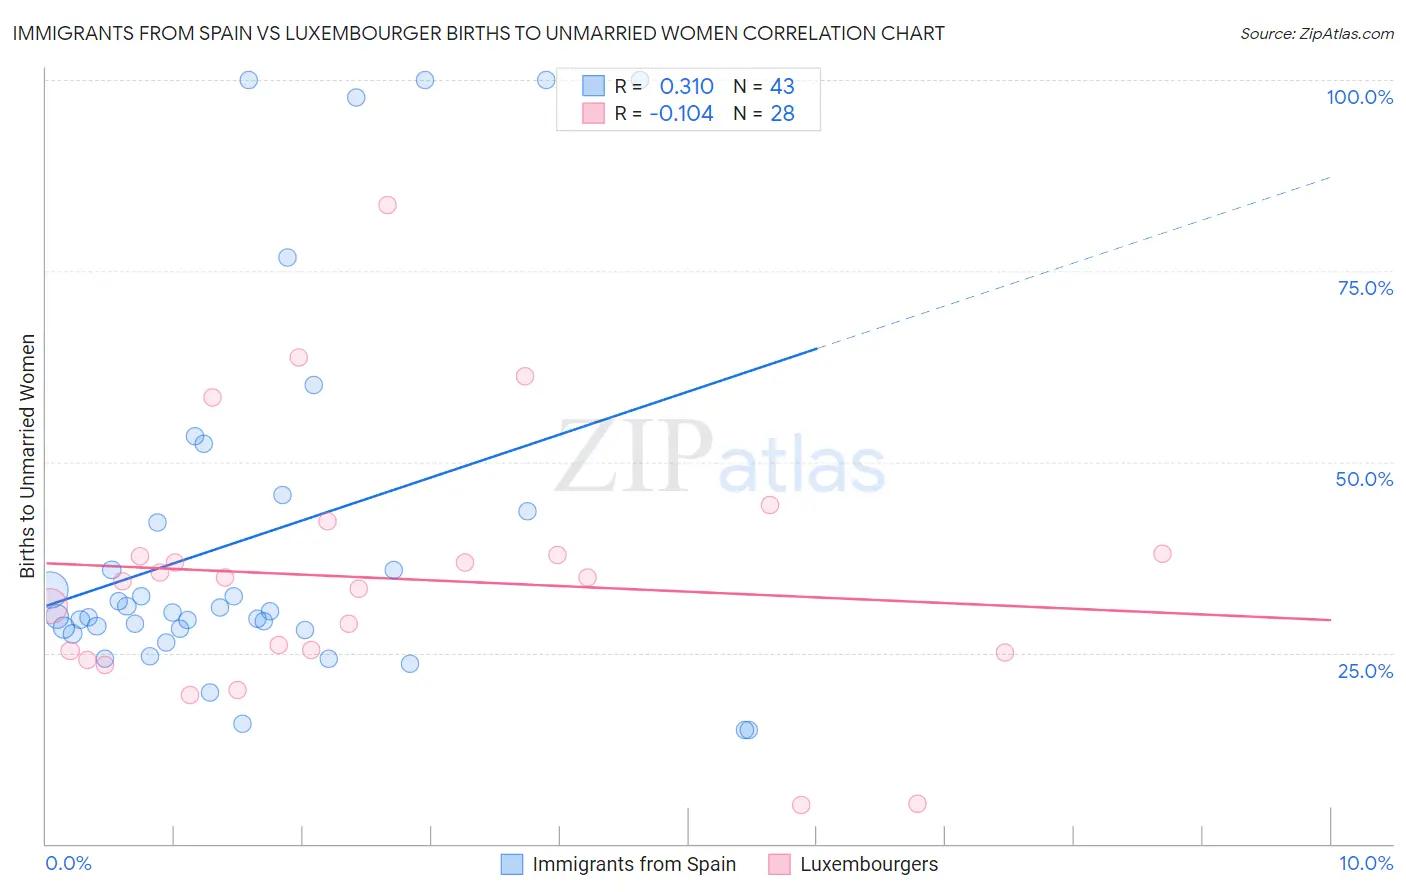
Immigrants from Spain vs Luxembourger Births to Unmarried Women Correlation Chart
The statistical analysis conducted on geographies consisting of 227,898,948 people shows a mild positive correlation between the proportion of Immigrants from Spain and percentage of births to unmarried women in the United States with a correlation coefficient (R) of 0.310 and weighted average of 30.3%. Similarly, the statistical analysis conducted on geographies consisting of 138,038,346 people shows a poor negative correlation between the proportion of Luxembourgers and percentage of births to unmarried women in the United States with a correlation coefficient (R) of -0.104 and weighted average of 29.4%, a difference of 3.1%.
Births to Unmarried Women Correlation Summary
| Measurement | Immigrants from Spain | Luxembourger |
| Minimum | 14.9% | 5.1% |
| Maximum | 100.0% | 83.6% |
| Range | 85.1% | 78.5% |
| Mean | 40.2% | 34.7% |
| Median | 30.3% | 34.6% |
| Interquartile 25% (IQ1) | 28.0% | 25.1% |
| Interquartile 75% (IQ3) | 43.6% | 37.9% |
| Interquartile Range (IQR) | 15.6% | 12.7% |
| Standard Deviation (Sample) | 24.6% | 16.7% |
| Standard Deviation (Population) | 24.3% | 16.4% |
Similar Demographics by Births to Unmarried Women
Demographics Similar to Immigrants from Spain by Births to Unmarried Women
In terms of births to unmarried women, the demographic groups most similar to Immigrants from Spain are Immigrants from Bosnia and Herzegovina (30.3%, a difference of 0.010%), Immigrants from Zimbabwe (30.3%, a difference of 0.020%), Icelander (30.3%, a difference of 0.040%), New Zealander (30.3%, a difference of 0.060%), and Immigrants from Morocco (30.4%, a difference of 0.11%).
| Demographics | Rating | Rank | Births to Unmarried Women |
| Immigrants | Argentina | 88.7 /100 | #122 | Excellent 30.1% |
| Syrians | 88.2 /100 | #123 | Excellent 30.2% |
| Croatians | 88.0 /100 | #124 | Excellent 30.2% |
| Vietnamese | 87.7 /100 | #125 | Excellent 30.2% |
| Europeans | 87.2 /100 | #126 | Excellent 30.2% |
| Chinese | 87.1 /100 | #127 | Excellent 30.2% |
| Icelanders | 86.0 /100 | #128 | Excellent 30.3% |
| Immigrants | Spain | 85.8 /100 | #129 | Excellent 30.3% |
| Immigrants | Bosnia and Herzegovina | 85.7 /100 | #130 | Excellent 30.3% |
| Immigrants | Zimbabwe | 85.7 /100 | #131 | Excellent 30.3% |
| New Zealanders | 85.5 /100 | #132 | Excellent 30.3% |
| Immigrants | Morocco | 85.2 /100 | #133 | Excellent 30.4% |
| Immigrants | South Eastern Asia | 85.2 /100 | #134 | Excellent 30.4% |
| Brazilians | 84.8 /100 | #135 | Excellent 30.4% |
| Immigrants | Scotland | 84.6 /100 | #136 | Excellent 30.4% |
Demographics Similar to Luxembourgers by Births to Unmarried Women
In terms of births to unmarried women, the demographic groups most similar to Luxembourgers are Immigrants from Denmark (29.4%, a difference of 0.0%), Immigrants from Syria (29.4%, a difference of 0.24%), Immigrants from South Africa (29.3%, a difference of 0.26%), Immigrants from Northern Africa (29.5%, a difference of 0.29%), and Norwegian (29.3%, a difference of 0.30%).
| Demographics | Rating | Rank | Births to Unmarried Women |
| Estonians | 96.5 /100 | #93 | Exceptional 29.2% |
| Ukrainians | 96.3 /100 | #94 | Exceptional 29.2% |
| Immigrants | Vietnam | 96.1 /100 | #95 | Exceptional 29.3% |
| Norwegians | 95.8 /100 | #96 | Exceptional 29.3% |
| Immigrants | South Africa | 95.7 /100 | #97 | Exceptional 29.3% |
| Immigrants | Syria | 95.7 /100 | #98 | Exceptional 29.4% |
| Immigrants | Denmark | 95.3 /100 | #99 | Exceptional 29.4% |
| Luxembourgers | 95.2 /100 | #100 | Exceptional 29.4% |
| Immigrants | Northern Africa | 94.7 /100 | #101 | Exceptional 29.5% |
| Australians | 94.6 /100 | #102 | Exceptional 29.5% |
| Lebanese | 94.4 /100 | #103 | Exceptional 29.5% |
| Lithuanians | 94.4 /100 | #104 | Exceptional 29.6% |
| Immigrants | Nepal | 94.3 /100 | #105 | Exceptional 29.6% |
| Swedes | 93.8 /100 | #106 | Exceptional 29.6% |
| Immigrants | Brazil | 93.7 /100 | #107 | Exceptional 29.6% |