Immigrants from Liberia vs Ute Single Mother Households
COMPARE
Immigrants from Liberia
Ute
Single Mother Households
Single Mother Households Comparison
Immigrants from Liberia
Ute
8.7%
SINGLE MOTHER HOUSEHOLDS
0.0/ 100
METRIC RATING
334th/ 347
METRIC RANK
7.1%
SINGLE MOTHER HOUSEHOLDS
1.0/ 100
METRIC RATING
236th/ 347
METRIC RANK
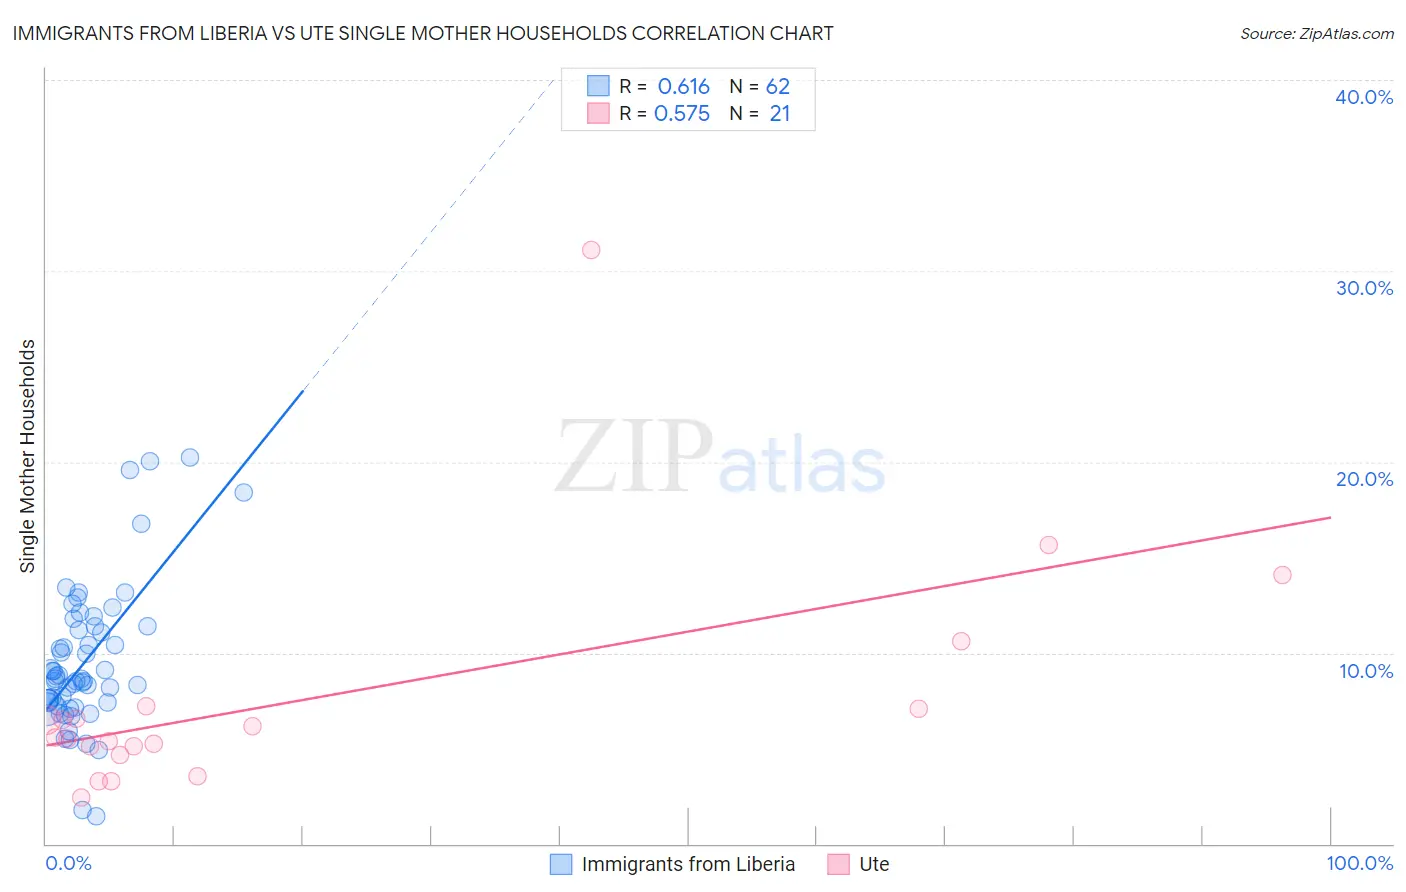
Immigrants from Liberia vs Ute Single Mother Households Correlation Chart
The statistical analysis conducted on geographies consisting of 135,205,486 people shows a significant positive correlation between the proportion of Immigrants from Liberia and percentage of single mother households in the United States with a correlation coefficient (R) of 0.616 and weighted average of 8.7%. Similarly, the statistical analysis conducted on geographies consisting of 55,640,483 people shows a substantial positive correlation between the proportion of Ute and percentage of single mother households in the United States with a correlation coefficient (R) of 0.575 and weighted average of 7.1%, a difference of 22.6%.
Single Mother Households Correlation Summary
| Measurement | Immigrants from Liberia | Ute |
| Minimum | 1.4% | 2.4% |
| Maximum | 20.2% | 31.1% |
| Range | 18.8% | 28.6% |
| Mean | 9.6% | 7.6% |
| Median | 8.7% | 5.6% |
| Interquartile 25% (IQ1) | 7.4% | 4.9% |
| Interquartile 75% (IQ3) | 11.4% | 7.1% |
| Interquartile Range (IQR) | 4.0% | 2.3% |
| Standard Deviation (Sample) | 3.8% | 6.3% |
| Standard Deviation (Population) | 3.7% | 6.1% |
Similar Demographics by Single Mother Households
Demographics Similar to Immigrants from Liberia by Single Mother Households
In terms of single mother households, the demographic groups most similar to Immigrants from Liberia are Immigrants from Dominica (8.7%, a difference of 0.29%), Puerto Rican (8.7%, a difference of 0.33%), Liberian (8.6%, a difference of 0.80%), U.S. Virgin Islander (8.6%, a difference of 1.1%), and Navajo (8.8%, a difference of 1.5%).
| Demographics | Rating | Rank | Single Mother Households |
| Immigrants | Haiti | 0.0 /100 | #327 | Tragic 8.4% |
| Yakama | 0.0 /100 | #328 | Tragic 8.4% |
| Hopi | 0.0 /100 | #329 | Tragic 8.5% |
| Inupiat | 0.0 /100 | #330 | Tragic 8.5% |
| Sioux | 0.0 /100 | #331 | Tragic 8.5% |
| U.S. Virgin Islanders | 0.0 /100 | #332 | Tragic 8.6% |
| Liberians | 0.0 /100 | #333 | Tragic 8.6% |
| Immigrants | Liberia | 0.0 /100 | #334 | Tragic 8.7% |
| Immigrants | Dominica | 0.0 /100 | #335 | Tragic 8.7% |
| Puerto Ricans | 0.0 /100 | #336 | Tragic 8.7% |
| Navajo | 0.0 /100 | #337 | Tragic 8.8% |
| Cape Verdeans | 0.0 /100 | #338 | Tragic 8.9% |
| Blacks/African Americans | 0.0 /100 | #339 | Tragic 9.0% |
| Lumbee | 0.0 /100 | #340 | Tragic 9.1% |
| Tohono O'odham | 0.0 /100 | #341 | Tragic 9.1% |
Demographics Similar to Ute by Single Mother Households
In terms of single mother households, the demographic groups most similar to Ute are Arapaho (7.1%, a difference of 0.090%), Panamanian (7.1%, a difference of 0.23%), Kiowa (7.1%, a difference of 0.50%), Immigrants from Burma/Myanmar (7.0%, a difference of 0.79%), and Immigrants from Panama (7.2%, a difference of 0.82%).
| Demographics | Rating | Rank | Single Mother Households |
| Immigrants | Kenya | 2.1 /100 | #229 | Tragic 7.0% |
| Creek | 1.6 /100 | #230 | Tragic 7.0% |
| Spanish Americans | 1.6 /100 | #231 | Tragic 7.0% |
| Comanche | 1.5 /100 | #232 | Tragic 7.0% |
| Choctaw | 1.4 /100 | #233 | Tragic 7.0% |
| Chickasaw | 1.4 /100 | #234 | Tragic 7.0% |
| Immigrants | Burma/Myanmar | 1.4 /100 | #235 | Tragic 7.0% |
| Ute | 1.0 /100 | #236 | Tragic 7.1% |
| Arapaho | 1.0 /100 | #237 | Tragic 7.1% |
| Panamanians | 0.9 /100 | #238 | Tragic 7.1% |
| Kiowa | 0.8 /100 | #239 | Tragic 7.1% |
| Immigrants | Panama | 0.7 /100 | #240 | Tragic 7.2% |
| Immigrants | Portugal | 0.6 /100 | #241 | Tragic 7.2% |
| Fijians | 0.6 /100 | #242 | Tragic 7.2% |
| Ecuadorians | 0.6 /100 | #243 | Tragic 7.2% |