Immigrants from Latin America vs Pima Divorced or Separated
COMPARE
Immigrants from Latin America
Pima
Divorced or Separated
Divorced or Separated Comparison
Immigrants from Latin America
Pima
12.4%
DIVORCED OR SEPARATED
2.8/ 100
METRIC RATING
243rd/ 347
METRIC RANK
12.9%
DIVORCED OR SEPARATED
0.0/ 100
METRIC RATING
290th/ 347
METRIC RANK
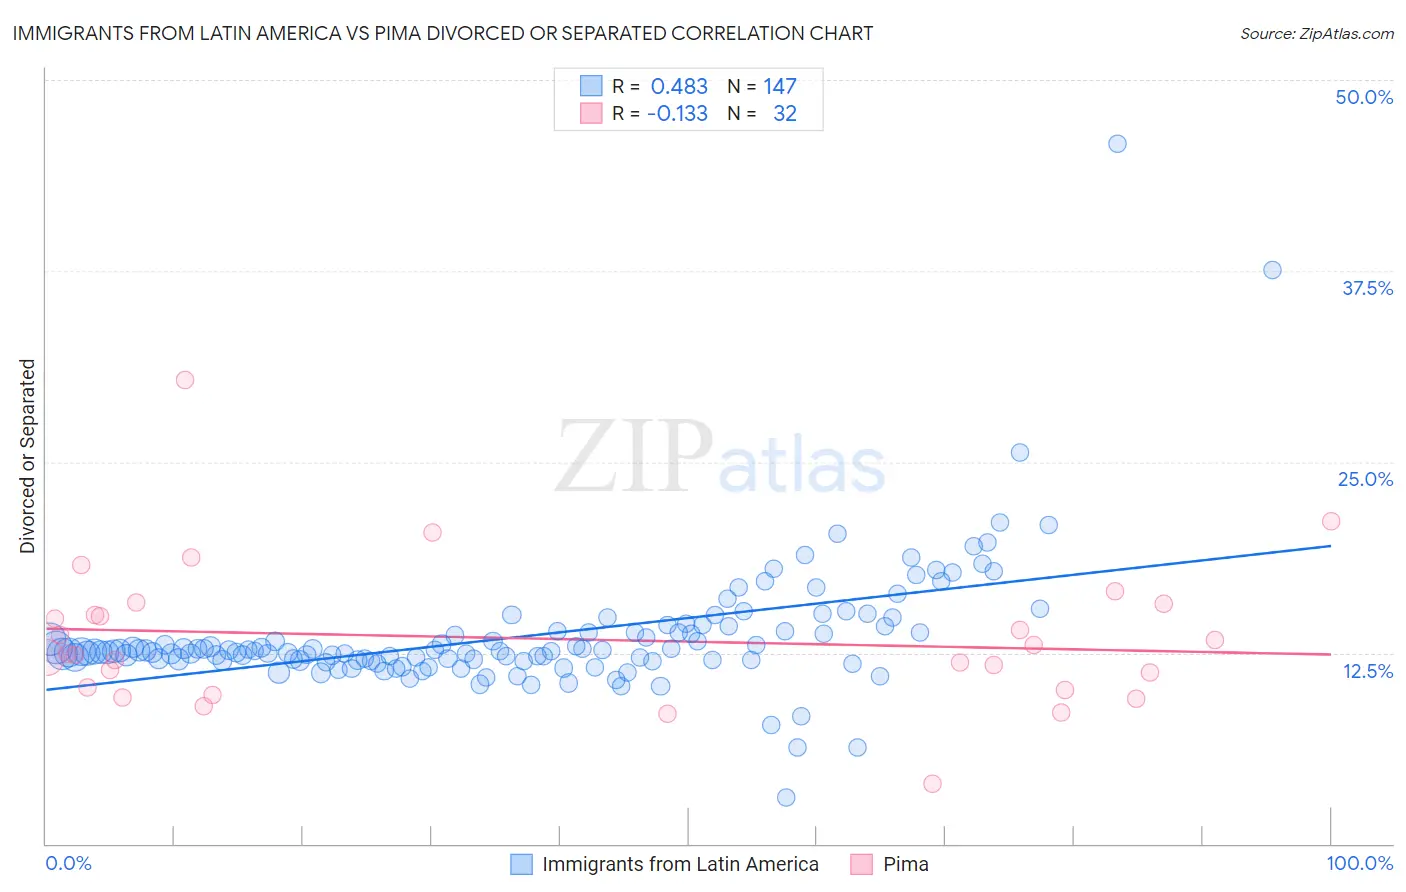
Immigrants from Latin America vs Pima Divorced or Separated Correlation Chart
The statistical analysis conducted on geographies consisting of 558,222,982 people shows a moderate positive correlation between the proportion of Immigrants from Latin America and percentage of population currently divorced or separated in the United States with a correlation coefficient (R) of 0.483 and weighted average of 12.4%. Similarly, the statistical analysis conducted on geographies consisting of 61,551,758 people shows a poor negative correlation between the proportion of Pima and percentage of population currently divorced or separated in the United States with a correlation coefficient (R) of -0.133 and weighted average of 12.9%, a difference of 3.7%.
Divorced or Separated Correlation Summary
| Measurement | Immigrants from Latin America | Pima |
| Minimum | 3.0% | 3.9% |
| Maximum | 45.8% | 30.4% |
| Range | 42.8% | 26.5% |
| Mean | 13.6% | 13.4% |
| Median | 12.6% | 12.4% |
| Interquartile 25% (IQ1) | 12.0% | 10.2% |
| Interquartile 75% (IQ3) | 13.9% | 15.4% |
| Interquartile Range (IQR) | 1.9% | 5.2% |
| Standard Deviation (Sample) | 4.3% | 4.8% |
| Standard Deviation (Population) | 4.3% | 4.7% |
Similar Demographics by Divorced or Separated
Demographics Similar to Immigrants from Latin America by Divorced or Separated
In terms of divorced or separated, the demographic groups most similar to Immigrants from Latin America are Dutch (12.4%, a difference of 0.070%), Alaska Native (12.4%, a difference of 0.10%), Uruguayan (12.4%, a difference of 0.15%), British West Indian (12.4%, a difference of 0.24%), and Immigrants from Germany (12.4%, a difference of 0.29%).
| Demographics | Rating | Rank | Divorced or Separated |
| Colombians | 4.2 /100 | #236 | Tragic 12.4% |
| Immigrants | Laos | 4.2 /100 | #237 | Tragic 12.4% |
| Sudanese | 4.0 /100 | #238 | Tragic 12.4% |
| Immigrants | Germany | 4.0 /100 | #239 | Tragic 12.4% |
| British West Indians | 3.7 /100 | #240 | Tragic 12.4% |
| Uruguayans | 3.4 /100 | #241 | Tragic 12.4% |
| Dutch | 3.1 /100 | #242 | Tragic 12.4% |
| Immigrants | Latin America | 2.8 /100 | #243 | Tragic 12.4% |
| Alaska Natives | 2.5 /100 | #244 | Tragic 12.4% |
| Hispanics or Latinos | 2.0 /100 | #245 | Tragic 12.5% |
| Immigrants | West Indies | 1.9 /100 | #246 | Tragic 12.5% |
| Germans | 1.8 /100 | #247 | Tragic 12.5% |
| Nepalese | 1.8 /100 | #248 | Tragic 12.5% |
| Finns | 1.8 /100 | #249 | Tragic 12.5% |
| Irish | 1.3 /100 | #250 | Tragic 12.5% |
Demographics Similar to Pima by Divorced or Separated
In terms of divorced or separated, the demographic groups most similar to Pima are Immigrants from Honduras (12.9%, a difference of 0.12%), Iroquois (12.9%, a difference of 0.14%), Scotch-Irish (12.9%, a difference of 0.17%), French Canadian (12.8%, a difference of 0.29%), and Jamaican (12.9%, a difference of 0.38%).
| Demographics | Rating | Rank | Divorced or Separated |
| Delaware | 0.1 /100 | #283 | Tragic 12.7% |
| Immigrants | Nonimmigrants | 0.1 /100 | #284 | Tragic 12.8% |
| French | 0.1 /100 | #285 | Tragic 12.8% |
| Spanish | 0.1 /100 | #286 | Tragic 12.8% |
| Hondurans | 0.1 /100 | #287 | Tragic 12.8% |
| French Canadians | 0.1 /100 | #288 | Tragic 12.8% |
| Iroquois | 0.0 /100 | #289 | Tragic 12.9% |
| Pima | 0.0 /100 | #290 | Tragic 12.9% |
| Immigrants | Honduras | 0.0 /100 | #291 | Tragic 12.9% |
| Scotch-Irish | 0.0 /100 | #292 | Tragic 12.9% |
| Jamaicans | 0.0 /100 | #293 | Tragic 12.9% |
| Apache | 0.0 /100 | #294 | Tragic 12.9% |
| Celtics | 0.0 /100 | #295 | Tragic 13.0% |
| Nicaraguans | 0.0 /100 | #296 | Tragic 13.0% |
| Natives/Alaskans | 0.0 /100 | #297 | Tragic 13.0% |