Immigrants from Jamaica vs Paraguayan Births to Unmarried Women

COMPARE

Immigrants from Jamaica
Race
Ancestry
AfghanAfricanAlaska NativeAlaskan AthabascanAlbanianAleutAlsatianAmericanApacheArabArapahoArgentineanArmenianAssyrian/Chaldean/SyriacAustralianAustrianBahamianBangladeshiBarbadianBasqueBelgianBelizeanBermudanBhutaneseBlackfeetBolivianBrazilianBritishBritish West IndianBulgarianBurmeseCajunCambodianCanadianCape VerdeanCarpatho RusynCelticCentral AmericanCentral American IndianCherokeeCheyenneChickasawChileanChineseChippewaChoctawColombianColvilleComancheCosta RicanCreeCreekCroatianCrowCubanCypriotCzechCzechoslovakianDanishDelawareDominicanDutchDutch West IndianEastern EuropeanEcuadorianEgyptianEnglishEstonianEthiopianEuropeanFijianFilipinoFinnishFrenchFrench American IndianFrench CanadianGermanGerman RussianGhanaianGreekGuamanian/ChamorroGuatemalanGuyaneseHaitianHmongHonduranHopiHoumaHungarianIcelanderIndian (Asian)IndonesianInupiatIranianIraqiIrishIroquoisIsraeliItalianJamaicanJapaneseJordanianKenyanKiowaKoreanLaotianLatvianLebaneseLiberianLithuanianLumbeeLuxembourgerMacedonianMalaysianMalteseMarshalleseMenomineeMexicanMexican American IndianMongolianMoroccanNative HawaiianNavajoNepaleseNew ZealanderNicaraguanNigerianNorthern EuropeanNorwegianOkinawanOsageOttawaPaiutePakistaniPalestinianPanamanianPennsylvania GermanPeruvianPimaPolishPortuguesePotawatomiPuebloPuerto RicanPuget Sound SalishRomanianRussianSalvadoranSamoanScandinavianScotch-IrishScottishSeminoleSenegaleseSerbianShoshoneSierra LeoneanSiouxSlavicSlovakSloveneSomaliSouth AfricanSouth AmericanSouth American IndianSoviet UnionSpaniardSpanishSpanish AmericanSpanish American IndianSri LankanSubsaharan AfricanSudaneseSwedishSwissSyrianTaiwaneseThaiTlingit-HaidaTohono O'OdhamTonganTrinidadian and TobagonianTsimshianTurkishU.S. Virgin IslanderUgandanUkrainianUruguayanUteVenezuelanVietnameseWelshWest IndianYakamaYaquiYugoslavianYumanYup'ikZimbabwean
Immigration
NonimmigrantsImmigrantsAfghanistanAfricaAlbaniaArgentinaArmeniaAsiaAustraliaAustriaBahamasBangladeshBarbadosBelarusBelgiumBelizeBoliviaBosnia and HerzegovinaBrazilBulgariaBurma/MyanmarCabo VerdeCambodiaCameroonCanadaCaribbeanCentral AmericaChileChinaColombiaCongoCosta RicaCroatiaCubaCzechoslovakiaDenmarkDominicaDominican RepublicEastern AfricaEastern AsiaEastern EuropeEcuadorEgyptEl SalvadorEnglandEritreaEthiopiaEuropeFijiFranceGermanyGhanaGreeceGrenadaGuatemalaGuyanaHaitiHondurasHong KongHungaryIndiaIndonesiaIranIraqIrelandIsraelItalyJamaicaJapanJordanKazakhstanKenyaKoreaKuwaitLaosLatin AmericaLatviaLebanonLiberiaLithuaniaMalaysiaMexicoMicronesiaMiddle AfricaMoldovaMoroccoNepalNetherlandsNicaraguaNigeriaNorth AmericaNorth MacedoniaNorthern AfricaNorthern EuropeNorwayOceaniaPakistanPanamaPeruPhilippinesPolandPortugalRomaniaRussiaSaudi ArabiaScotlandSenegalSerbiaSierra LeoneSingaporeSomaliaSouth AfricaSouth AmericaSouth Central AsiaSouth Eastern AsiaSouthern EuropeSpainSri LankaSt. Vincent and the GrenadinesSudanSwedenSwitzerlandSyriaTaiwanThailandTrinidad and TobagoTurkeyUgandaUkraineUruguayUzbekistanVenezuelaVietnamWest IndiesWestern AfricaWestern AsiaWestern EuropeYemenZaireZimbabweAzores
Paraguayan
Race
Ancestry
AfghanAfricanAlaska NativeAlaskan AthabascanAlbanianAleutAlsatianAmericanApacheArabArapahoArgentineanArmenianAssyrian/Chaldean/SyriacAustralianAustrianBahamianBangladeshiBarbadianBasqueBelgianBelizeanBermudanBhutaneseBlackfeetBolivianBrazilianBritishBritish West IndianBulgarianBurmeseCajunCambodianCanadianCape VerdeanCarpatho RusynCelticCentral AmericanCentral American IndianCherokeeCheyenneChickasawChileanChineseChippewaChoctawColombianColvilleComancheCosta RicanCreeCreekCroatianCrowCubanCypriotCzechCzechoslovakianDanishDelawareDominicanDutchDutch West IndianEastern EuropeanEcuadorianEgyptianEnglishEstonianEthiopianEuropeanFijianFilipinoFinnishFrenchFrench American IndianFrench CanadianGermanGerman RussianGhanaianGreekGuamanian/ChamorroGuatemalanGuyaneseHaitianHmongHonduranHopiHoumaHungarianIcelanderIndian (Asian)IndonesianInupiatIranianIraqiIrishIroquoisIsraeliItalianJamaicanJapaneseJordanianKenyanKiowaKoreanLaotianLatvianLebaneseLiberianLithuanianLumbeeLuxembourgerMacedonianMalaysianMalteseMarshalleseMenomineeMexicanMexican American IndianMongolianMoroccanNative HawaiianNavajoNepaleseNew ZealanderNicaraguanNigerianNorthern EuropeanNorwegianOkinawanOsageOttawaPaiutePakistaniPalestinianPanamanianParaguayanPennsylvania GermanPeruvianPimaPolishPortuguesePotawatomiPuebloPuerto RicanPuget Sound SalishRomanianRussianSalvadoranSamoanScandinavianScotch-IrishScottishSeminoleSenegaleseSerbianShoshoneSierra LeoneanSiouxSlavicSlovakSloveneSomaliSouth AfricanSouth AmericanSouth American IndianSoviet UnionSpaniardSpanishSpanish AmericanSpanish American IndianSri LankanSubsaharan AfricanSudaneseSwedishSwissSyrianTaiwaneseThaiTlingit-HaidaTohono O'OdhamTonganTrinidadian and TobagonianTsimshianTurkishU.S. Virgin IslanderUgandanUkrainianUruguayanUteVenezuelanVietnameseWelshWest IndianYakamaYaquiYugoslavianYumanYup'ikZimbabwean
Immigration
NonimmigrantsImmigrantsAfghanistanAfricaAlbaniaArgentinaArmeniaAsiaAustraliaAustriaBahamasBangladeshBarbadosBelarusBelgiumBelizeBoliviaBosnia and HerzegovinaBrazilBulgariaBurma/MyanmarCabo VerdeCambodiaCameroonCanadaCaribbeanCentral AmericaChileChinaColombiaCongoCosta RicaCroatiaCubaCzechoslovakiaDenmarkDominicaDominican RepublicEastern AfricaEastern AsiaEastern EuropeEcuadorEgyptEl SalvadorEnglandEritreaEthiopiaEuropeFijiFranceGermanyGhanaGreeceGrenadaGuatemalaGuyanaHaitiHondurasHong KongHungaryIndiaIndonesiaIranIraqIrelandIsraelItalyJapanJordanKazakhstanKenyaKoreaKuwaitLaosLatin AmericaLatviaLebanonLiberiaLithuaniaMalaysiaMexicoMicronesiaMiddle AfricaMoldovaMoroccoNepalNetherlandsNicaraguaNigeriaNorth AmericaNorth MacedoniaNorthern AfricaNorthern EuropeNorwayOceaniaPakistanPanamaPeruPhilippinesPolandPortugalRomaniaRussiaSaudi ArabiaScotlandSenegalSerbiaSierra LeoneSingaporeSomaliaSouth AfricaSouth AmericaSouth Central AsiaSouth Eastern AsiaSouthern EuropeSpainSri LankaSt. Vincent and the GrenadinesSudanSwedenSwitzerlandSyriaTaiwanThailandTrinidad and TobagoTurkeyUgandaUkraineUruguayUzbekistanVenezuelaVietnamWest IndiesWestern AfricaWestern AsiaWestern EuropeYemenZaireZimbabweAzores
Births to Unmarried Women
Income
Poverty
Unemployment
Labor Participation
Family Structure
Vehicle Availability
Education Level
Disability

Births to Unmarried Women Comparison

Immigrants from Jamaica

Paraguayans

Tragic
Exceptional
38.8%
BIRTHS TO UNMARRIED WOMEN
0.0/ 100
METRIC RATING
303rd/ 347
METRIC RANK
29.7%
BIRTHS TO UNMARRIED WOMEN
93.5/ 100
METRIC RATING
108th/ 347
METRIC RANK

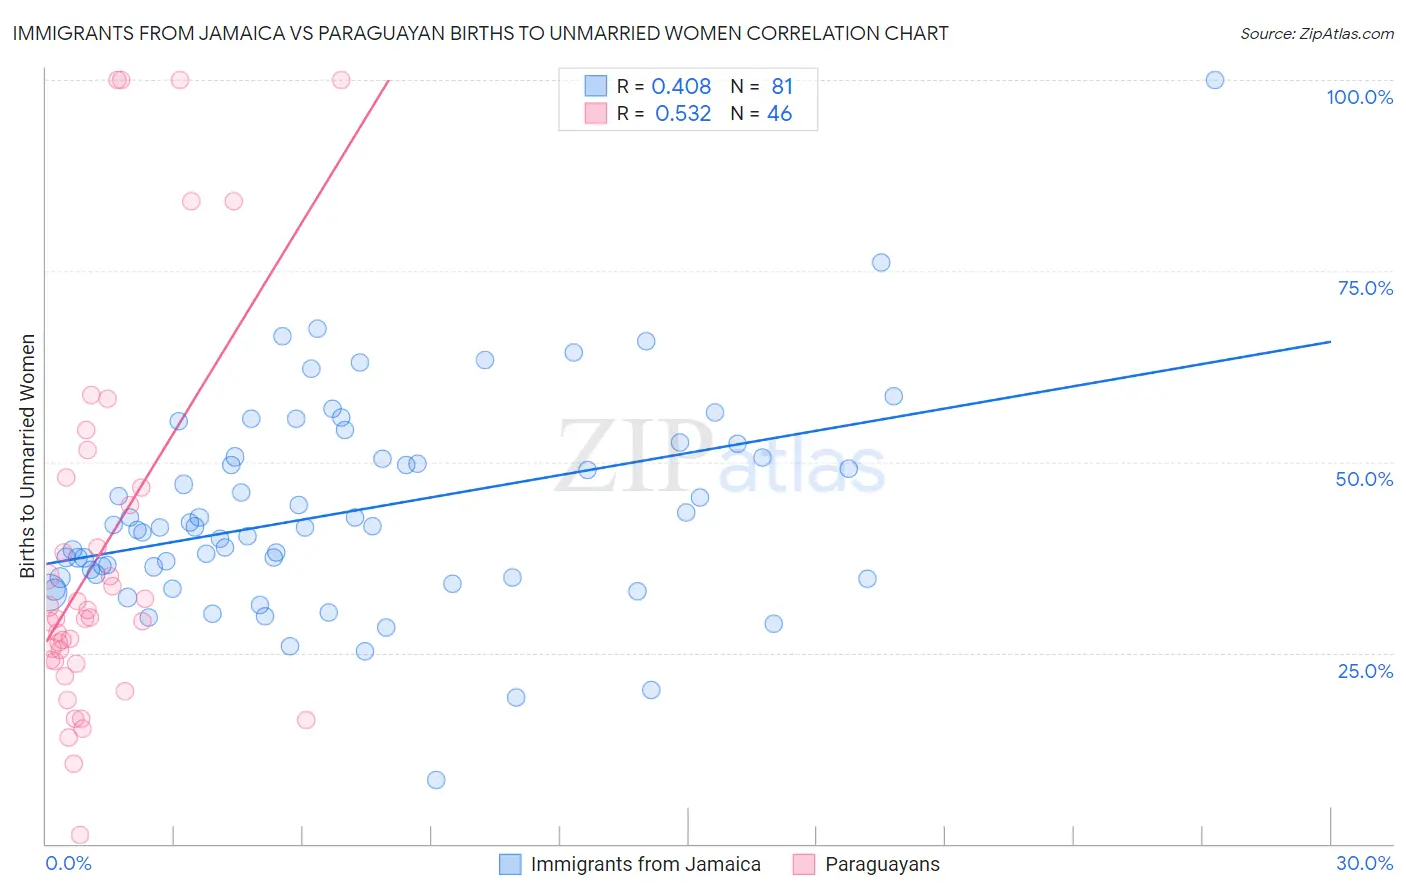
Immigrants from Jamaica vs Paraguayan Births to Unmarried Women Correlation Chart

The statistical analysis conducted on geographies consisting of 287,311,689 people shows a moderate positive correlation between the proportion of Immigrants from Jamaica and percentage of births to unmarried women in the United States with a correlation coefficient (R) of 0.408 and weighted average of 38.8%. Similarly, the statistical analysis conducted on geographies consisting of 92,447,839 people shows a substantial positive correlation between the proportion of Paraguayans and percentage of births to unmarried women in the United States with a correlation coefficient (R) of 0.532 and weighted average of 29.7%, a difference of 30.7%.
Immigrants from Jamaica vs Paraguayan Births to Unmarried Women

Births to Unmarried Women Correlation Summary

MeasurementImmigrants from JamaicaParaguayan
Minimum8.3%1.1%
Maximum100.0%100.0%
Range91.7%98.9%
Mean43.5%38.3%
Median41.4%29.5%
Interquartile 25% (IQ1)34.8%23.9%
Interquartile 75% (IQ3)50.6%46.7%
Interquartile Range (IQR)15.8%22.8%
Standard Deviation (Sample)13.7%25.3%
Standard Deviation (Population)13.6%25.0%

Similar Demographics by Births to Unmarried Women

Demographics Similar to Immigrants from Jamaica by Births to Unmarried Women

In terms of births to unmarried women, the demographic groups most similar to Immigrants from Jamaica are Yaqui (38.8%, a difference of 0.050%), Immigrants from Haiti (38.9%, a difference of 0.15%), Honduran (38.7%, a difference of 0.32%), Central American Indian (39.0%, a difference of 0.44%), and Haitian (38.6%, a difference of 0.56%).
DemographicsRating | RankBirths to Unmarried Women
Alaska Natives
0.0
/100
|
#296
Tragic
38.3%
Dutch West Indians
0.0
/100
|
#297
Tragic
38.4%
Jamaicans
0.0
/100
|
#298
Tragic
38.5%
Spanish Americans
0.0
/100
|
#299
Tragic
38.6%
Immigrants | West Indies
0.0
/100
|
#300
Tragic
38.6%
Haitians
0.0
/100
|
#301
Tragic
38.6%
Hondurans
0.0
/100
|
#302
Tragic
38.7%
Immigrants | Jamaica
0.0
/100
|
#303
Tragic
38.8%
Yaqui
0.0
/100
|
#304
Tragic
38.8%
Immigrants | Haiti
0.0
/100
|
#305
Tragic
38.9%
Central American Indians
0.0
/100
|
#306
Tragic
39.0%
Immigrants | Honduras
0.0
/100
|
#307
Tragic
39.3%
Aleuts
0.0
/100
|
#308
Tragic
39.3%
Cubans
0.0
/100
|
#309
Tragic
39.4%
Immigrants | Dominica
0.0
/100
|
#310
Tragic
39.5%

Demographics Similar to Paraguayans by Births to Unmarried Women

In terms of births to unmarried women, the demographic groups most similar to Paraguayans are Greek (29.7%, a difference of 0.040%), Immigrants from Ethiopia (29.7%, a difference of 0.070%), Immigrants from Brazil (29.6%, a difference of 0.090%), Swedish (29.6%, a difference of 0.10%), and Immigrants from Hungary (29.7%, a difference of 0.20%).
DemographicsRating | RankBirths to Unmarried Women
Immigrants | Northern Africa
94.7
/100
|
#101
Exceptional
29.5%
Australians
94.6
/100
|
#102
Exceptional
29.5%
Lebanese
94.4
/100
|
#103
Exceptional
29.5%
Lithuanians
94.4
/100
|
#104
Exceptional
29.6%
Immigrants | Nepal
94.3
/100
|
#105
Exceptional
29.6%
Swedes
93.8
/100
|
#106
Exceptional
29.6%
Immigrants | Brazil
93.7
/100
|
#107
Exceptional
29.6%
Paraguayans
93.5
/100
|
#108
Exceptional
29.7%
Greeks
93.4
/100
|
#109
Exceptional
29.7%
Immigrants | Ethiopia
93.4
/100
|
#110
Exceptional
29.7%
Immigrants | Hungary
93.0
/100
|
#111
Exceptional
29.7%
Basques
93.0
/100
|
#112
Exceptional
29.7%
Scandinavians
92.7
/100
|
#113
Exceptional
29.8%
Immigrants | Croatia
92.6
/100
|
#114
Exceptional
29.8%
Ethiopians
91.9
/100
|
#115
Exceptional
29.8%