Immigrants from Haiti vs Turkish Births to Unmarried Women
COMPARE
Immigrants from Haiti
Turkish
Births to Unmarried Women
Births to Unmarried Women Comparison
Immigrants from Haiti
Turks
38.9%
BIRTHS TO UNMARRIED WOMEN
0.0/ 100
METRIC RATING
305th/ 347
METRIC RANK
27.4%
BIRTHS TO UNMARRIED WOMEN
99.6/ 100
METRIC RATING
40th/ 347
METRIC RANK
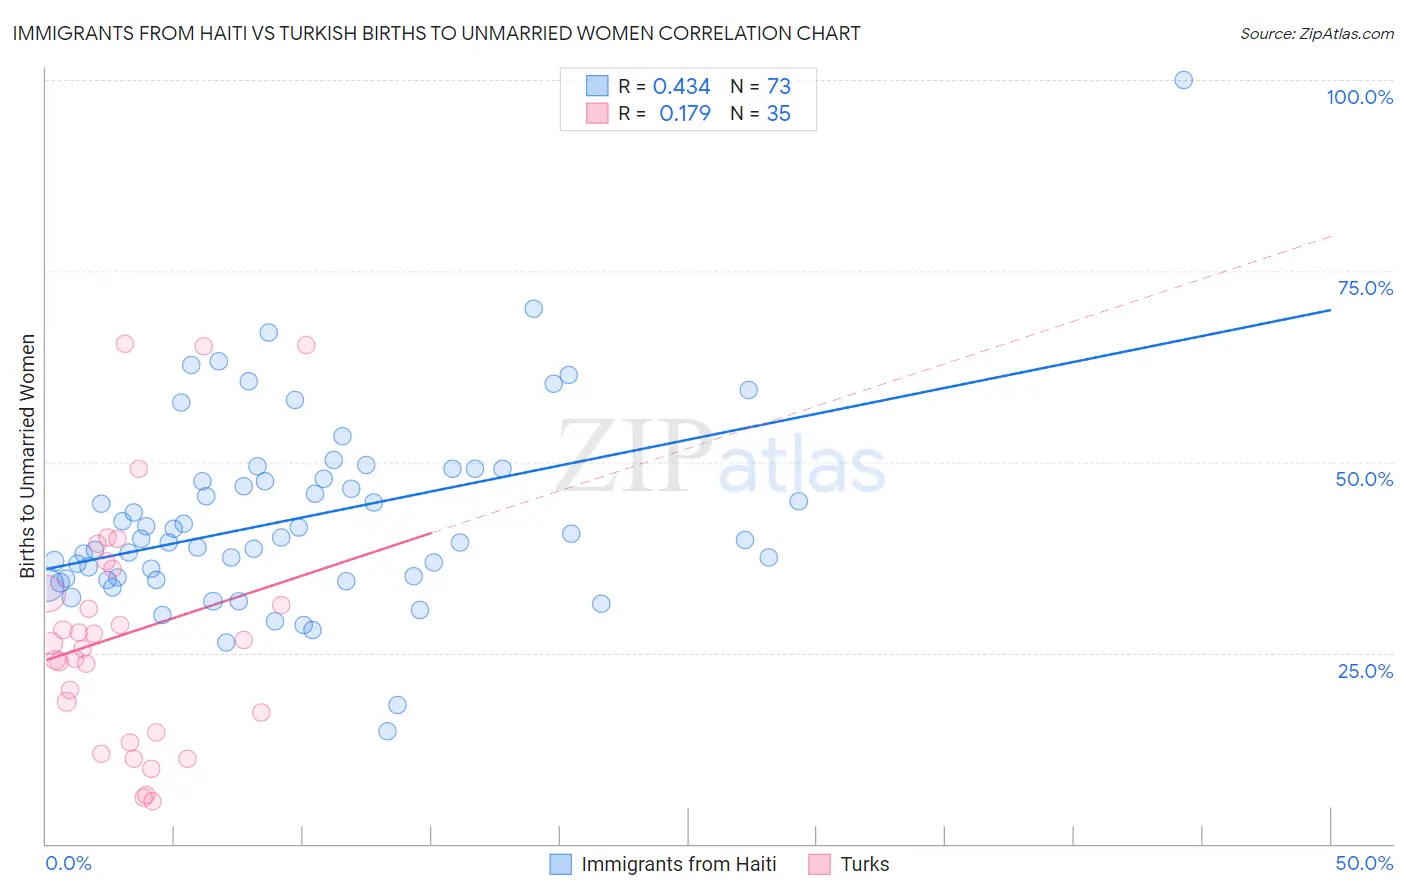
Immigrants from Haiti vs Turkish Births to Unmarried Women Correlation Chart
The statistical analysis conducted on geographies consisting of 215,750,595 people shows a moderate positive correlation between the proportion of Immigrants from Haiti and percentage of births to unmarried women in the United States with a correlation coefficient (R) of 0.434 and weighted average of 38.9%. Similarly, the statistical analysis conducted on geographies consisting of 255,026,742 people shows a poor positive correlation between the proportion of Turks and percentage of births to unmarried women in the United States with a correlation coefficient (R) of 0.179 and weighted average of 27.4%, a difference of 41.6%.
Births to Unmarried Women Correlation Summary
| Measurement | Immigrants from Haiti | Turkish |
| Minimum | 14.8% | 5.6% |
| Maximum | 100.0% | 65.5% |
| Range | 85.2% | 59.9% |
| Mean | 42.7% | 27.5% |
| Median | 39.9% | 26.3% |
| Interquartile 25% (IQ1) | 34.7% | 14.6% |
| Interquartile 75% (IQ3) | 48.5% | 36.0% |
| Interquartile Range (IQR) | 13.8% | 21.4% |
| Standard Deviation (Sample) | 12.8% | 15.9% |
| Standard Deviation (Population) | 12.7% | 15.7% |
Similar Demographics by Births to Unmarried Women
Demographics Similar to Immigrants from Haiti by Births to Unmarried Women
In terms of births to unmarried women, the demographic groups most similar to Immigrants from Haiti are Yaqui (38.8%, a difference of 0.10%), Immigrants from Jamaica (38.8%, a difference of 0.15%), Central American Indian (39.0%, a difference of 0.29%), Honduran (38.7%, a difference of 0.47%), and Haitian (38.6%, a difference of 0.71%).
| Demographics | Rating | Rank | Births to Unmarried Women |
| Jamaicans | 0.0 /100 | #298 | Tragic 38.5% |
| Spanish Americans | 0.0 /100 | #299 | Tragic 38.6% |
| Immigrants | West Indies | 0.0 /100 | #300 | Tragic 38.6% |
| Haitians | 0.0 /100 | #301 | Tragic 38.6% |
| Hondurans | 0.0 /100 | #302 | Tragic 38.7% |
| Immigrants | Jamaica | 0.0 /100 | #303 | Tragic 38.8% |
| Yaqui | 0.0 /100 | #304 | Tragic 38.8% |
| Immigrants | Haiti | 0.0 /100 | #305 | Tragic 38.9% |
| Central American Indians | 0.0 /100 | #306 | Tragic 39.0% |
| Immigrants | Honduras | 0.0 /100 | #307 | Tragic 39.3% |
| Aleuts | 0.0 /100 | #308 | Tragic 39.3% |
| Cubans | 0.0 /100 | #309 | Tragic 39.4% |
| Immigrants | Dominica | 0.0 /100 | #310 | Tragic 39.5% |
| Immigrants | Azores | 0.0 /100 | #311 | Tragic 39.6% |
| U.S. Virgin Islanders | 0.0 /100 | #312 | Tragic 39.6% |
Demographics Similar to Turks by Births to Unmarried Women
In terms of births to unmarried women, the demographic groups most similar to Turks are Immigrants from Malaysia (27.4%, a difference of 0.32%), Iraqi (27.6%, a difference of 0.41%), Immigrants from Eastern Europe (27.6%, a difference of 0.43%), Immigrants from Moldova (27.3%, a difference of 0.61%), and Immigrants from Bulgaria (27.6%, a difference of 0.66%).
| Demographics | Rating | Rank | Births to Unmarried Women |
| Immigrants | Sri Lanka | 99.8 /100 | #33 | Exceptional 27.2% |
| Immigrants | Pakistan | 99.8 /100 | #34 | Exceptional 27.2% |
| Immigrants | Ireland | 99.7 /100 | #35 | Exceptional 27.2% |
| Immigrants | Western Asia | 99.7 /100 | #36 | Exceptional 27.2% |
| Immigrants | Ukraine | 99.7 /100 | #37 | Exceptional 27.2% |
| Immigrants | Moldova | 99.7 /100 | #38 | Exceptional 27.3% |
| Immigrants | Malaysia | 99.7 /100 | #39 | Exceptional 27.4% |
| Turks | 99.6 /100 | #40 | Exceptional 27.4% |
| Iraqis | 99.6 /100 | #41 | Exceptional 27.6% |
| Immigrants | Eastern Europe | 99.6 /100 | #42 | Exceptional 27.6% |
| Immigrants | Bulgaria | 99.6 /100 | #43 | Exceptional 27.6% |
| Immigrants | Indonesia | 99.5 /100 | #44 | Exceptional 27.7% |
| Latvians | 99.5 /100 | #45 | Exceptional 27.7% |
| Immigrants | Lithuania | 99.5 /100 | #46 | Exceptional 27.7% |
| Hmong | 99.5 /100 | #47 | Exceptional 27.7% |