Palestinian vs Turkish Births to Unmarried Women

COMPARE

Palestinian
Race
Ancestry
AfghanAfricanAlaska NativeAlaskan AthabascanAlbanianAleutAlsatianAmericanApacheArabArapahoArgentineanArmenianAssyrian/Chaldean/SyriacAustralianAustrianBahamianBangladeshiBarbadianBasqueBelgianBelizeanBermudanBhutaneseBlackfeetBolivianBrazilianBritishBritish West IndianBulgarianBurmeseCajunCambodianCanadianCape VerdeanCarpatho RusynCelticCentral AmericanCentral American IndianCherokeeCheyenneChickasawChileanChineseChippewaChoctawColombianColvilleComancheCosta RicanCreeCreekCroatianCrowCubanCypriotCzechCzechoslovakianDanishDelawareDominicanDutchDutch West IndianEastern EuropeanEcuadorianEgyptianEnglishEstonianEthiopianEuropeanFijianFilipinoFinnishFrenchFrench American IndianFrench CanadianGermanGerman RussianGhanaianGreekGuamanian/ChamorroGuatemalanGuyaneseHaitianHmongHonduranHopiHoumaHungarianIcelanderIndian (Asian)IndonesianInupiatIranianIraqiIrishIroquoisIsraeliItalianJamaicanJapaneseJordanianKenyanKiowaKoreanLaotianLatvianLebaneseLiberianLithuanianLumbeeLuxembourgerMacedonianMalaysianMalteseMarshalleseMenomineeMexicanMexican American IndianMongolianMoroccanNative HawaiianNavajoNepaleseNew ZealanderNicaraguanNigerianNorthern EuropeanNorwegianOkinawanOsageOttawaPaiutePakistaniPalestinianPanamanianParaguayanPennsylvania GermanPeruvianPimaPolishPortuguesePotawatomiPuebloPuerto RicanPuget Sound SalishRomanianRussianSalvadoranSamoanScandinavianScotch-IrishScottishSeminoleSenegaleseSerbianShoshoneSierra LeoneanSiouxSlavicSlovakSloveneSomaliSouth AfricanSouth AmericanSouth American IndianSoviet UnionSpaniardSpanishSpanish AmericanSpanish American IndianSri LankanSubsaharan AfricanSudaneseSwedishSwissSyrianTaiwaneseThaiTlingit-HaidaTohono O'OdhamTonganTrinidadian and TobagonianTsimshianU.S. Virgin IslanderUgandanUkrainianUruguayanUteVenezuelanVietnameseWelshWest IndianYakamaYaquiYugoslavianYumanYup'ikZimbabwean
Immigration
NonimmigrantsImmigrantsAfghanistanAfricaAlbaniaArgentinaArmeniaAsiaAustraliaAustriaBahamasBangladeshBarbadosBelarusBelgiumBelizeBoliviaBosnia and HerzegovinaBrazilBulgariaBurma/MyanmarCabo VerdeCambodiaCameroonCanadaCaribbeanCentral AmericaChileChinaColombiaCongoCosta RicaCroatiaCubaCzechoslovakiaDenmarkDominicaDominican RepublicEastern AfricaEastern AsiaEastern EuropeEcuadorEgyptEl SalvadorEnglandEritreaEthiopiaEuropeFijiFranceGermanyGhanaGreeceGrenadaGuatemalaGuyanaHaitiHondurasHong KongHungaryIndiaIndonesiaIranIraqIrelandIsraelItalyJamaicaJapanJordanKazakhstanKenyaKoreaKuwaitLaosLatin AmericaLatviaLebanonLiberiaLithuaniaMalaysiaMexicoMicronesiaMiddle AfricaMoldovaMoroccoNepalNetherlandsNicaraguaNigeriaNorth AmericaNorth MacedoniaNorthern AfricaNorthern EuropeNorwayOceaniaPakistanPanamaPeruPhilippinesPolandPortugalRomaniaRussiaSaudi ArabiaScotlandSenegalSerbiaSierra LeoneSingaporeSomaliaSouth AfricaSouth AmericaSouth Central AsiaSouth Eastern AsiaSouthern EuropeSpainSri LankaSt. Vincent and the GrenadinesSudanSwedenSwitzerlandSyriaTaiwanThailandTrinidad and TobagoTurkeyUgandaUkraineUruguayUzbekistanVenezuelaVietnamWest IndiesWestern AfricaWestern AsiaWestern EuropeYemenZaireZimbabweAzores
Turkish
Race
Ancestry
AfghanAfricanAlaska NativeAlaskan AthabascanAlbanianAleutAlsatianAmericanApacheArabArapahoArgentineanArmenianAssyrian/Chaldean/SyriacAustralianAustrianBahamianBangladeshiBarbadianBasqueBelgianBelizeanBermudanBhutaneseBlackfeetBolivianBrazilianBritishBritish West IndianBulgarianBurmeseCajunCambodianCanadianCape VerdeanCarpatho RusynCelticCentral AmericanCentral American IndianCherokeeCheyenneChickasawChileanChineseChippewaChoctawColombianColvilleComancheCosta RicanCreeCreekCroatianCrowCubanCypriotCzechCzechoslovakianDanishDelawareDominicanDutchDutch West IndianEastern EuropeanEcuadorianEgyptianEnglishEstonianEthiopianEuropeanFijianFilipinoFinnishFrenchFrench American IndianFrench CanadianGermanGerman RussianGhanaianGreekGuamanian/ChamorroGuatemalanGuyaneseHaitianHmongHonduranHopiHoumaHungarianIcelanderIndian (Asian)IndonesianInupiatIranianIraqiIrishIroquoisIsraeliItalianJamaicanJapaneseJordanianKenyanKiowaKoreanLaotianLatvianLebaneseLiberianLithuanianLumbeeLuxembourgerMacedonianMalaysianMalteseMarshalleseMenomineeMexicanMexican American IndianMongolianMoroccanNative HawaiianNavajoNepaleseNew ZealanderNicaraguanNigerianNorthern EuropeanNorwegianOkinawanOsageOttawaPaiutePakistaniPanamanianParaguayanPennsylvania GermanPeruvianPimaPolishPortuguesePotawatomiPuebloPuerto RicanPuget Sound SalishRomanianRussianSalvadoranSamoanScandinavianScotch-IrishScottishSeminoleSenegaleseSerbianShoshoneSierra LeoneanSiouxSlavicSlovakSloveneSomaliSouth AfricanSouth AmericanSouth American IndianSoviet UnionSpaniardSpanishSpanish AmericanSpanish American IndianSri LankanSubsaharan AfricanSudaneseSwedishSwissSyrianTaiwaneseThaiTlingit-HaidaTohono O'OdhamTonganTrinidadian and TobagonianTsimshianTurkishU.S. Virgin IslanderUgandanUkrainianUruguayanUteVenezuelanVietnameseWelshWest IndianYakamaYaquiYugoslavianYumanYup'ikZimbabwean
Immigration
NonimmigrantsImmigrantsAfghanistanAfricaAlbaniaArgentinaArmeniaAsiaAustraliaAustriaBahamasBangladeshBarbadosBelarusBelgiumBelizeBoliviaBosnia and HerzegovinaBrazilBulgariaBurma/MyanmarCabo VerdeCambodiaCameroonCanadaCaribbeanCentral AmericaChileChinaColombiaCongoCosta RicaCroatiaCubaCzechoslovakiaDenmarkDominicaDominican RepublicEastern AfricaEastern AsiaEastern EuropeEcuadorEgyptEl SalvadorEnglandEritreaEthiopiaEuropeFijiFranceGermanyGhanaGreeceGrenadaGuatemalaGuyanaHaitiHondurasHong KongHungaryIndiaIndonesiaIranIraqIrelandIsraelItalyJamaicaJapanJordanKazakhstanKenyaKoreaKuwaitLaosLatin AmericaLatviaLebanonLiberiaLithuaniaMalaysiaMexicoMicronesiaMiddle AfricaMoldovaMoroccoNepalNetherlandsNicaraguaNigeriaNorth AmericaNorth MacedoniaNorthern AfricaNorthern EuropeNorwayOceaniaPakistanPanamaPeruPhilippinesPolandPortugalRomaniaRussiaSaudi ArabiaScotlandSenegalSerbiaSierra LeoneSingaporeSomaliaSouth AfricaSouth AmericaSouth Central AsiaSouth Eastern AsiaSouthern EuropeSpainSri LankaSt. Vincent and the GrenadinesSudanSwedenSwitzerlandSyriaTaiwanThailandTrinidad and TobagoTurkeyUgandaUkraineUruguayUzbekistanVenezuelaVietnamWest IndiesWestern AfricaWestern AsiaWestern EuropeYemenZaireZimbabweAzores
Births to Unmarried Women
Income
Poverty
Unemployment
Labor Participation
Family Structure
Vehicle Availability
Education Level
Disability

Births to Unmarried Women Comparison

Palestinians

Turks

Exceptional
Exceptional
28.4%
BIRTHS TO UNMARRIED WOMEN
98.7/ 100
METRIC RATING
67th/ 347
METRIC RANK
27.4%
BIRTHS TO UNMARRIED WOMEN
99.6/ 100
METRIC RATING
40th/ 347
METRIC RANK

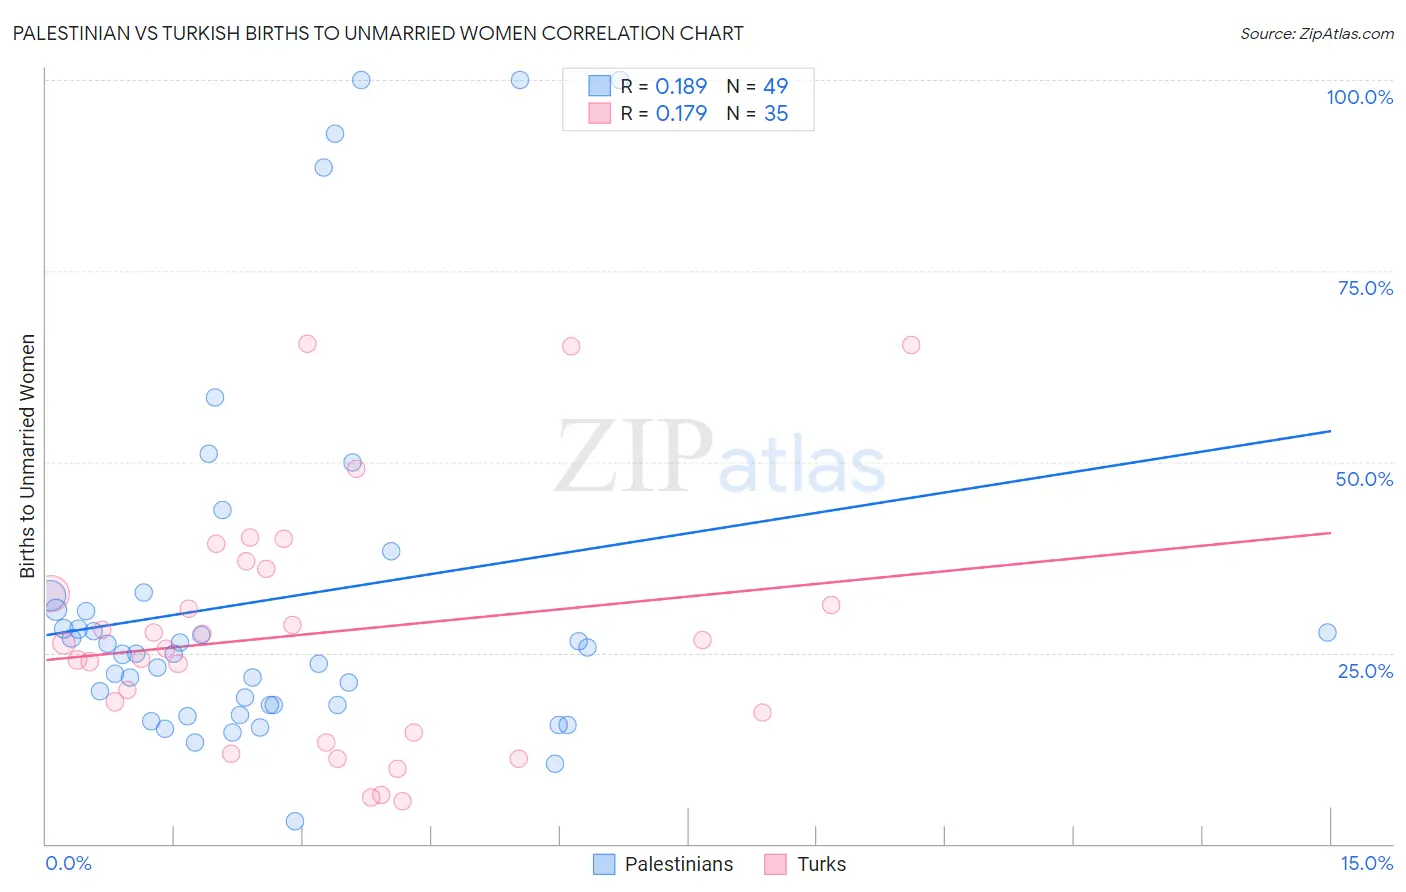
Palestinian vs Turkish Births to Unmarried Women Correlation Chart

The statistical analysis conducted on geographies consisting of 207,464,489 people shows a poor positive correlation between the proportion of Palestinians and percentage of births to unmarried women in the United States with a correlation coefficient (R) of 0.189 and weighted average of 28.4%. Similarly, the statistical analysis conducted on geographies consisting of 255,026,742 people shows a poor positive correlation between the proportion of Turks and percentage of births to unmarried women in the United States with a correlation coefficient (R) of 0.179 and weighted average of 27.4%, a difference of 3.6%.
Palestinian vs Turkish Births to Unmarried Women

Births to Unmarried Women Correlation Summary

MeasurementPalestinianTurkish
Minimum2.9%5.6%
Maximum100.0%65.5%
Range97.1%59.9%
Mean32.1%27.5%
Median24.9%26.3%
Interquartile 25% (IQ1)18.1%14.6%
Interquartile 75% (IQ3)31.6%36.0%
Interquartile Range (IQR)13.5%21.4%
Standard Deviation (Sample)24.2%15.9%
Standard Deviation (Population)23.9%15.7%

Similar Demographics by Births to Unmarried Women

Demographics Similar to Palestinians by Births to Unmarried Women

In terms of births to unmarried women, the demographic groups most similar to Palestinians are Immigrants from Europe (28.4%, a difference of 0.050%), Bolivian (28.5%, a difference of 0.090%), Immigrants from Egypt (28.4%, a difference of 0.11%), Immigrants from Czechoslovakia (28.4%, a difference of 0.13%), and Tongan (28.4%, a difference of 0.15%).
DemographicsRating | RankBirths to Unmarried Women
Immigrants | Turkey
99.1
/100
|
#60
Exceptional
28.1%
Immigrants | North Macedonia
99.1
/100
|
#61
Exceptional
28.1%
Egyptians
99.0
/100
|
#62
Exceptional
28.2%
Immigrants | Serbia
98.9
/100
|
#63
Exceptional
28.3%
Tongans
98.8
/100
|
#64
Exceptional
28.4%
Immigrants | Czechoslovakia
98.8
/100
|
#65
Exceptional
28.4%
Immigrants | Egypt
98.8
/100
|
#66
Exceptional
28.4%
Palestinians
98.7
/100
|
#67
Exceptional
28.4%
Immigrants | Europe
98.7
/100
|
#68
Exceptional
28.4%
Bolivians
98.7
/100
|
#69
Exceptional
28.5%
Laotians
98.6
/100
|
#70
Exceptional
28.5%
Jordanians
98.5
/100
|
#71
Exceptional
28.5%
Immigrants | Sweden
98.5
/100
|
#72
Exceptional
28.5%
Albanians
98.5
/100
|
#73
Exceptional
28.5%
Immigrants | Bolivia
98.5
/100
|
#74
Exceptional
28.6%

Demographics Similar to Turks by Births to Unmarried Women

In terms of births to unmarried women, the demographic groups most similar to Turks are Immigrants from Malaysia (27.4%, a difference of 0.32%), Iraqi (27.6%, a difference of 0.41%), Immigrants from Eastern Europe (27.6%, a difference of 0.43%), Immigrants from Moldova (27.3%, a difference of 0.61%), and Immigrants from Bulgaria (27.6%, a difference of 0.66%).
DemographicsRating | RankBirths to Unmarried Women
Immigrants | Sri Lanka
99.8
/100
|
#33
Exceptional
27.2%
Immigrants | Pakistan
99.8
/100
|
#34
Exceptional
27.2%
Immigrants | Ireland
99.7
/100
|
#35
Exceptional
27.2%
Immigrants | Western Asia
99.7
/100
|
#36
Exceptional
27.2%
Immigrants | Ukraine
99.7
/100
|
#37
Exceptional
27.2%
Immigrants | Moldova
99.7
/100
|
#38
Exceptional
27.3%
Immigrants | Malaysia
99.7
/100
|
#39
Exceptional
27.4%
Turks
99.6
/100
|
#40
Exceptional
27.4%
Iraqis
99.6
/100
|
#41
Exceptional
27.6%
Immigrants | Eastern Europe
99.6
/100
|
#42
Exceptional
27.6%
Immigrants | Bulgaria
99.6
/100
|
#43
Exceptional
27.6%
Immigrants | Indonesia
99.5
/100
|
#44
Exceptional
27.7%
Latvians
99.5
/100
|
#45
Exceptional
27.7%
Immigrants | Lithuania
99.5
/100
|
#46
Exceptional
27.7%
Hmong
99.5
/100
|
#47
Exceptional
27.7%