Immigrants from Guatemala vs Immigrants from Turkey Currently Married

COMPARE

Immigrants from Guatemala
Race
Ancestry
AfghanAfricanAlaska NativeAlaskan AthabascanAlbanianAleutAlsatianAmericanApacheArabArapahoArgentineanArmenianAssyrian/Chaldean/SyriacAustralianAustrianBahamianBangladeshiBarbadianBasqueBelgianBelizeanBermudanBhutaneseBlackfeetBolivianBrazilianBritishBritish West IndianBulgarianBurmeseCajunCambodianCanadianCape VerdeanCarpatho RusynCelticCentral AmericanCentral American IndianCherokeeCheyenneChickasawChileanChineseChippewaChoctawColombianColvilleComancheCosta RicanCreeCreekCroatianCrowCubanCypriotCzechCzechoslovakianDanishDelawareDominicanDutchDutch West IndianEastern EuropeanEcuadorianEgyptianEnglishEstonianEthiopianEuropeanFijianFilipinoFinnishFrenchFrench American IndianFrench CanadianGermanGerman RussianGhanaianGreekGuamanian/ChamorroGuatemalanGuyaneseHaitianHmongHonduranHopiHoumaHungarianIcelanderIndian (Asian)IndonesianInupiatIranianIraqiIrishIroquoisIsraeliItalianJamaicanJapaneseJordanianKenyanKiowaKoreanLaotianLatvianLebaneseLiberianLithuanianLumbeeLuxembourgerMacedonianMalaysianMalteseMarshalleseMenomineeMexicanMexican American IndianMongolianMoroccanNative HawaiianNavajoNepaleseNew ZealanderNicaraguanNigerianNorthern EuropeanNorwegianOkinawanOsageOttawaPaiutePakistaniPalestinianPanamanianParaguayanPennsylvania GermanPeruvianPimaPolishPortuguesePotawatomiPuebloPuerto RicanPuget Sound SalishRomanianRussianSalvadoranSamoanScandinavianScotch-IrishScottishSeminoleSenegaleseSerbianShoshoneSierra LeoneanSiouxSlavicSlovakSloveneSomaliSouth AfricanSouth AmericanSouth American IndianSoviet UnionSpaniardSpanishSpanish AmericanSpanish American IndianSri LankanSubsaharan AfricanSudaneseSwedishSwissSyrianTaiwaneseThaiTlingit-HaidaTohono O'OdhamTonganTrinidadian and TobagonianTsimshianTurkishU.S. Virgin IslanderUgandanUkrainianUruguayanUteVenezuelanVietnameseWelshWest IndianYakamaYaquiYugoslavianYumanYup'ikZimbabwean
Immigration
NonimmigrantsImmigrantsAfghanistanAfricaAlbaniaArgentinaArmeniaAsiaAustraliaAustriaBahamasBangladeshBarbadosBelarusBelgiumBelizeBoliviaBosnia and HerzegovinaBrazilBulgariaBurma/MyanmarCabo VerdeCambodiaCameroonCanadaCaribbeanCentral AmericaChileChinaColombiaCongoCosta RicaCroatiaCubaCzechoslovakiaDenmarkDominicaDominican RepublicEastern AfricaEastern AsiaEastern EuropeEcuadorEgyptEl SalvadorEnglandEritreaEthiopiaEuropeFijiFranceGermanyGhanaGreeceGrenadaGuatemalaGuyanaHaitiHondurasHong KongHungaryIndiaIndonesiaIranIraqIrelandIsraelItalyJamaicaJapanJordanKazakhstanKenyaKoreaKuwaitLaosLatin AmericaLatviaLebanonLiberiaLithuaniaMalaysiaMexicoMicronesiaMiddle AfricaMoldovaMoroccoNepalNetherlandsNicaraguaNigeriaNorth AmericaNorth MacedoniaNorthern AfricaNorthern EuropeNorwayOceaniaPakistanPanamaPeruPhilippinesPolandPortugalRomaniaRussiaSaudi ArabiaScotlandSenegalSerbiaSierra LeoneSingaporeSomaliaSouth AfricaSouth AmericaSouth Central AsiaSouth Eastern AsiaSouthern EuropeSpainSri LankaSt. Vincent and the GrenadinesSudanSwedenSwitzerlandSyriaTaiwanThailandTrinidad and TobagoUgandaUkraineUruguayUzbekistanVenezuelaVietnamWest IndiesWestern AfricaWestern AsiaWestern EuropeYemenZaireZimbabweAzores
Immigrants from Turkey
Race
Ancestry
AfghanAfricanAlaska NativeAlaskan AthabascanAlbanianAleutAlsatianAmericanApacheArabArapahoArgentineanArmenianAssyrian/Chaldean/SyriacAustralianAustrianBahamianBangladeshiBarbadianBasqueBelgianBelizeanBermudanBhutaneseBlackfeetBolivianBrazilianBritishBritish West IndianBulgarianBurmeseCajunCambodianCanadianCape VerdeanCarpatho RusynCelticCentral AmericanCentral American IndianCherokeeCheyenneChickasawChileanChineseChippewaChoctawColombianColvilleComancheCosta RicanCreeCreekCroatianCrowCubanCypriotCzechCzechoslovakianDanishDelawareDominicanDutchDutch West IndianEastern EuropeanEcuadorianEgyptianEnglishEstonianEthiopianEuropeanFijianFilipinoFinnishFrenchFrench American IndianFrench CanadianGermanGerman RussianGhanaianGreekGuamanian/ChamorroGuatemalanGuyaneseHaitianHmongHonduranHopiHoumaHungarianIcelanderIndian (Asian)IndonesianInupiatIranianIraqiIrishIroquoisIsraeliItalianJamaicanJapaneseJordanianKenyanKiowaKoreanLaotianLatvianLebaneseLiberianLithuanianLumbeeLuxembourgerMacedonianMalaysianMalteseMarshalleseMenomineeMexicanMexican American IndianMongolianMoroccanNative HawaiianNavajoNepaleseNew ZealanderNicaraguanNigerianNorthern EuropeanNorwegianOkinawanOsageOttawaPaiutePakistaniPalestinianPanamanianParaguayanPennsylvania GermanPeruvianPimaPolishPortuguesePotawatomiPuebloPuerto RicanPuget Sound SalishRomanianRussianSalvadoranSamoanScandinavianScotch-IrishScottishSeminoleSenegaleseSerbianShoshoneSierra LeoneanSiouxSlavicSlovakSloveneSomaliSouth AfricanSouth AmericanSouth American IndianSoviet UnionSpaniardSpanishSpanish AmericanSpanish American IndianSri LankanSubsaharan AfricanSudaneseSwedishSwissSyrianTaiwaneseThaiTlingit-HaidaTohono O'OdhamTonganTrinidadian and TobagonianTsimshianTurkishU.S. Virgin IslanderUgandanUkrainianUruguayanUteVenezuelanVietnameseWelshWest IndianYakamaYaquiYugoslavianYumanYup'ikZimbabwean
Immigration
NonimmigrantsImmigrantsAfghanistanAfricaAlbaniaArgentinaArmeniaAsiaAustraliaAustriaBahamasBangladeshBarbadosBelarusBelgiumBelizeBoliviaBosnia and HerzegovinaBrazilBulgariaBurma/MyanmarCabo VerdeCambodiaCameroonCanadaCaribbeanCentral AmericaChileChinaColombiaCongoCosta RicaCroatiaCubaCzechoslovakiaDenmarkDominicaDominican RepublicEastern AfricaEastern AsiaEastern EuropeEcuadorEgyptEl SalvadorEnglandEritreaEthiopiaEuropeFijiFranceGermanyGhanaGreeceGrenadaGuyanaHaitiHondurasHong KongHungaryIndiaIndonesiaIranIraqIrelandIsraelItalyJamaicaJapanJordanKazakhstanKenyaKoreaKuwaitLaosLatin AmericaLatviaLebanonLiberiaLithuaniaMalaysiaMexicoMicronesiaMiddle AfricaMoldovaMoroccoNepalNetherlandsNicaraguaNigeriaNorth AmericaNorth MacedoniaNorthern AfricaNorthern EuropeNorwayOceaniaPakistanPanamaPeruPhilippinesPolandPortugalRomaniaRussiaSaudi ArabiaScotlandSenegalSerbiaSierra LeoneSingaporeSomaliaSouth AfricaSouth AmericaSouth Central AsiaSouth Eastern AsiaSouthern EuropeSpainSri LankaSt. Vincent and the GrenadinesSudanSwedenSwitzerlandSyriaTaiwanThailandTrinidad and TobagoTurkeyUgandaUkraineUruguayUzbekistanVenezuelaVietnamWest IndiesWestern AfricaWestern AsiaWestern EuropeYemenZaireZimbabweAzores
Currently Married
Income
Poverty
Unemployment
Labor Participation
Family Structure
Vehicle Availability
Education Level
Disability

Currently Married Comparison

Immigrants from Guatemala

Immigrants from Turkey

Tragic
Good
42.6%
CURRENTLY MARRIED
0.0/ 100
METRIC RATING
291st/ 347
METRIC RANK
47.0%
CURRENTLY MARRIED
70.0/ 100
METRIC RATING
150th/ 347
METRIC RANK

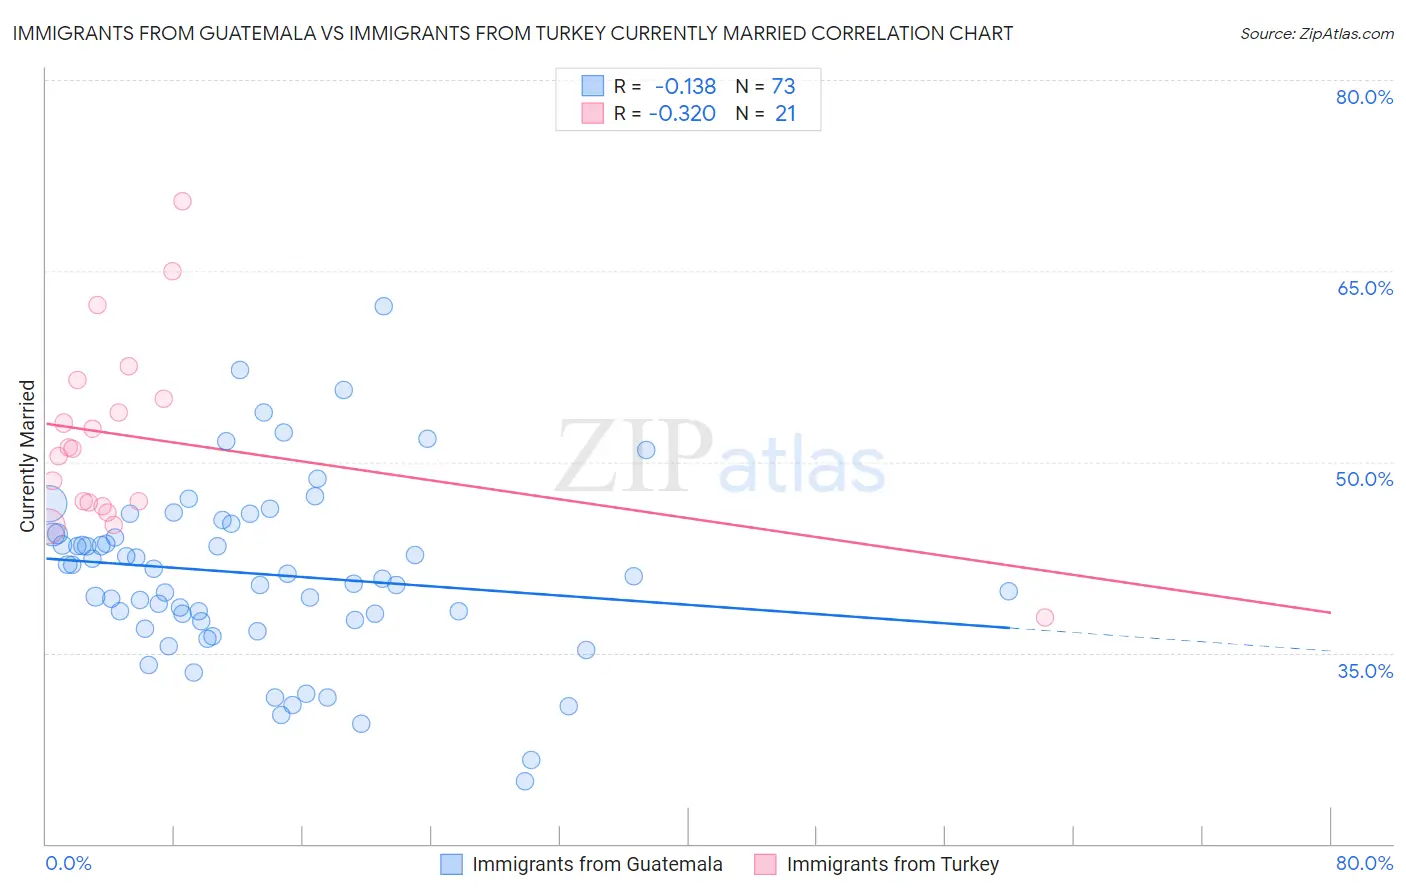
Immigrants from Guatemala vs Immigrants from Turkey Currently Married Correlation Chart

The statistical analysis conducted on geographies consisting of 377,254,434 people shows a poor negative correlation between the proportion of Immigrants from Guatemala and percentage of population currently married in the United States with a correlation coefficient (R) of -0.138 and weighted average of 42.6%. Similarly, the statistical analysis conducted on geographies consisting of 223,037,239 people shows a mild negative correlation between the proportion of Immigrants from Turkey and percentage of population currently married in the United States with a correlation coefficient (R) of -0.320 and weighted average of 47.0%, a difference of 10.2%.
Immigrants from Guatemala vs Immigrants from Turkey Currently Married

Currently Married Correlation Summary

MeasurementImmigrants from GuatemalaImmigrants from Turkey
Minimum24.9%37.8%
Maximum62.2%70.5%
Range37.3%32.7%
Mean41.2%51.8%
Median41.0%51.0%
Interquartile 25% (IQ1)37.6%46.7%
Interquartile 75% (IQ3)44.7%55.7%
Interquartile Range (IQR)7.1%9.0%
Standard Deviation (Sample)6.9%7.6%
Standard Deviation (Population)6.9%7.4%

Similar Demographics by Currently Married

Demographics Similar to Immigrants from Guatemala by Currently Married

In terms of currently married, the demographic groups most similar to Immigrants from Guatemala are Paiute (42.7%, a difference of 0.12%), Immigrants from Ghana (42.7%, a difference of 0.12%), Subsaharan African (42.6%, a difference of 0.16%), Yuman (42.6%, a difference of 0.18%), and Honduran (42.5%, a difference of 0.30%).
DemographicsRating | RankCurrently Married
Immigrants | El Salvador
0.0
/100
|
#284
Tragic
43.1%
Immigrants | Middle Africa
0.0
/100
|
#285
Tragic
43.0%
Ghanaians
0.0
/100
|
#286
Tragic
42.9%
Guatemalans
0.0
/100
|
#287
Tragic
42.9%
Natives/Alaskans
0.0
/100
|
#288
Tragic
42.8%
Paiute
0.0
/100
|
#289
Tragic
42.7%
Immigrants | Ghana
0.0
/100
|
#290
Tragic
42.7%
Immigrants | Guatemala
0.0
/100
|
#291
Tragic
42.6%
Sub-Saharan Africans
0.0
/100
|
#292
Tragic
42.6%
Yuman
0.0
/100
|
#293
Tragic
42.6%
Hondurans
0.0
/100
|
#294
Tragic
42.5%
Immigrants | Western Africa
0.0
/100
|
#295
Tragic
42.4%
Menominee
0.0
/100
|
#296
Tragic
42.3%
Cheyenne
0.0
/100
|
#297
Tragic
42.2%
Immigrants | Honduras
0.0
/100
|
#298
Tragic
42.2%

Demographics Similar to Immigrants from Turkey by Currently Married

In terms of currently married, the demographic groups most similar to Immigrants from Turkey are Zimbabwean (47.0%, a difference of 0.0%), Cambodian (47.0%, a difference of 0.010%), Chilean (47.0%, a difference of 0.010%), Immigrants from Serbia (47.0%, a difference of 0.050%), and Immigrants from Venezuela (47.0%, a difference of 0.060%).
DemographicsRating | RankCurrently Married
Guamanians/Chamorros
74.2
/100
|
#143
Good
47.1%
Hmong
73.4
/100
|
#144
Good
47.1%
Immigrants | South Eastern Asia
72.9
/100
|
#145
Good
47.1%
Carpatho Rusyns
72.6
/100
|
#146
Good
47.0%
Immigrants | Argentina
72.0
/100
|
#147
Good
47.0%
Cambodians
70.4
/100
|
#148
Good
47.0%
Zimbabweans
70.1
/100
|
#149
Good
47.0%
Immigrants | Turkey
70.0
/100
|
#150
Good
47.0%
Chileans
69.8
/100
|
#151
Good
47.0%
Immigrants | Serbia
68.8
/100
|
#152
Good
47.0%
Immigrants | Venezuela
68.6
/100
|
#153
Good
47.0%
Albanians
68.6
/100
|
#154
Good
47.0%
Arabs
68.6
/100
|
#155
Good
47.0%
Spanish
68.1
/100
|
#156
Good
47.0%
Immigrants | Switzerland
67.8
/100
|
#157
Good
46.9%