Immigrants from Guatemala vs Immigrants from Pakistan Currently Married

COMPARE

Immigrants from Guatemala
Race
Ancestry
AfghanAfricanAlaska NativeAlaskan AthabascanAlbanianAleutAlsatianAmericanApacheArabArapahoArgentineanArmenianAssyrian/Chaldean/SyriacAustralianAustrianBahamianBangladeshiBarbadianBasqueBelgianBelizeanBermudanBhutaneseBlackfeetBolivianBrazilianBritishBritish West IndianBulgarianBurmeseCajunCambodianCanadianCape VerdeanCarpatho RusynCelticCentral AmericanCentral American IndianCherokeeCheyenneChickasawChileanChineseChippewaChoctawColombianColvilleComancheCosta RicanCreeCreekCroatianCrowCubanCypriotCzechCzechoslovakianDanishDelawareDominicanDutchDutch West IndianEastern EuropeanEcuadorianEgyptianEnglishEstonianEthiopianEuropeanFijianFilipinoFinnishFrenchFrench American IndianFrench CanadianGermanGerman RussianGhanaianGreekGuamanian/ChamorroGuatemalanGuyaneseHaitianHmongHonduranHopiHoumaHungarianIcelanderIndian (Asian)IndonesianInupiatIranianIraqiIrishIroquoisIsraeliItalianJamaicanJapaneseJordanianKenyanKiowaKoreanLaotianLatvianLebaneseLiberianLithuanianLumbeeLuxembourgerMacedonianMalaysianMalteseMarshalleseMenomineeMexicanMexican American IndianMongolianMoroccanNative HawaiianNavajoNepaleseNew ZealanderNicaraguanNigerianNorthern EuropeanNorwegianOkinawanOsageOttawaPaiutePakistaniPalestinianPanamanianParaguayanPennsylvania GermanPeruvianPimaPolishPortuguesePotawatomiPuebloPuerto RicanPuget Sound SalishRomanianRussianSalvadoranSamoanScandinavianScotch-IrishScottishSeminoleSenegaleseSerbianShoshoneSierra LeoneanSiouxSlavicSlovakSloveneSomaliSouth AfricanSouth AmericanSouth American IndianSoviet UnionSpaniardSpanishSpanish AmericanSpanish American IndianSri LankanSubsaharan AfricanSudaneseSwedishSwissSyrianTaiwaneseThaiTlingit-HaidaTohono O'OdhamTonganTrinidadian and TobagonianTsimshianTurkishU.S. Virgin IslanderUgandanUkrainianUruguayanUteVenezuelanVietnameseWelshWest IndianYakamaYaquiYugoslavianYumanYup'ikZimbabwean
Immigration
NonimmigrantsImmigrantsAfghanistanAfricaAlbaniaArgentinaArmeniaAsiaAustraliaAustriaBahamasBangladeshBarbadosBelarusBelgiumBelizeBoliviaBosnia and HerzegovinaBrazilBulgariaBurma/MyanmarCabo VerdeCambodiaCameroonCanadaCaribbeanCentral AmericaChileChinaColombiaCongoCosta RicaCroatiaCubaCzechoslovakiaDenmarkDominicaDominican RepublicEastern AfricaEastern AsiaEastern EuropeEcuadorEgyptEl SalvadorEnglandEritreaEthiopiaEuropeFijiFranceGermanyGhanaGreeceGrenadaGuatemalaGuyanaHaitiHondurasHong KongHungaryIndiaIndonesiaIranIraqIrelandIsraelItalyJamaicaJapanJordanKazakhstanKenyaKoreaKuwaitLaosLatin AmericaLatviaLebanonLiberiaLithuaniaMalaysiaMexicoMicronesiaMiddle AfricaMoldovaMoroccoNepalNetherlandsNicaraguaNigeriaNorth AmericaNorth MacedoniaNorthern AfricaNorthern EuropeNorwayOceaniaPanamaPeruPhilippinesPolandPortugalRomaniaRussiaSaudi ArabiaScotlandSenegalSerbiaSierra LeoneSingaporeSomaliaSouth AfricaSouth AmericaSouth Central AsiaSouth Eastern AsiaSouthern EuropeSpainSri LankaSt. Vincent and the GrenadinesSudanSwedenSwitzerlandSyriaTaiwanThailandTrinidad and TobagoTurkeyUgandaUkraineUruguayUzbekistanVenezuelaVietnamWest IndiesWestern AfricaWestern AsiaWestern EuropeYemenZaireZimbabweAzores
Immigrants from Pakistan
Race
Ancestry
AfghanAfricanAlaska NativeAlaskan AthabascanAlbanianAleutAlsatianAmericanApacheArabArapahoArgentineanArmenianAssyrian/Chaldean/SyriacAustralianAustrianBahamianBangladeshiBarbadianBasqueBelgianBelizeanBermudanBhutaneseBlackfeetBolivianBrazilianBritishBritish West IndianBulgarianBurmeseCajunCambodianCanadianCape VerdeanCarpatho RusynCelticCentral AmericanCentral American IndianCherokeeCheyenneChickasawChileanChineseChippewaChoctawColombianColvilleComancheCosta RicanCreeCreekCroatianCrowCubanCypriotCzechCzechoslovakianDanishDelawareDominicanDutchDutch West IndianEastern EuropeanEcuadorianEgyptianEnglishEstonianEthiopianEuropeanFijianFilipinoFinnishFrenchFrench American IndianFrench CanadianGermanGerman RussianGhanaianGreekGuamanian/ChamorroGuatemalanGuyaneseHaitianHmongHonduranHopiHoumaHungarianIcelanderIndian (Asian)IndonesianInupiatIranianIraqiIrishIroquoisIsraeliItalianJamaicanJapaneseJordanianKenyanKiowaKoreanLaotianLatvianLebaneseLiberianLithuanianLumbeeLuxembourgerMacedonianMalaysianMalteseMarshalleseMenomineeMexicanMexican American IndianMongolianMoroccanNative HawaiianNavajoNepaleseNew ZealanderNicaraguanNigerianNorthern EuropeanNorwegianOkinawanOsageOttawaPaiutePakistaniPalestinianPanamanianParaguayanPennsylvania GermanPeruvianPimaPolishPortuguesePotawatomiPuebloPuerto RicanPuget Sound SalishRomanianRussianSalvadoranSamoanScandinavianScotch-IrishScottishSeminoleSenegaleseSerbianShoshoneSierra LeoneanSiouxSlavicSlovakSloveneSomaliSouth AfricanSouth AmericanSouth American IndianSoviet UnionSpaniardSpanishSpanish AmericanSpanish American IndianSri LankanSubsaharan AfricanSudaneseSwedishSwissSyrianTaiwaneseThaiTlingit-HaidaTohono O'OdhamTonganTrinidadian and TobagonianTsimshianTurkishU.S. Virgin IslanderUgandanUkrainianUruguayanUteVenezuelanVietnameseWelshWest IndianYakamaYaquiYugoslavianYumanYup'ikZimbabwean
Immigration
NonimmigrantsImmigrantsAfghanistanAfricaAlbaniaArgentinaArmeniaAsiaAustraliaAustriaBahamasBangladeshBarbadosBelarusBelgiumBelizeBoliviaBosnia and HerzegovinaBrazilBulgariaBurma/MyanmarCabo VerdeCambodiaCameroonCanadaCaribbeanCentral AmericaChileChinaColombiaCongoCosta RicaCroatiaCubaCzechoslovakiaDenmarkDominicaDominican RepublicEastern AfricaEastern AsiaEastern EuropeEcuadorEgyptEl SalvadorEnglandEritreaEthiopiaEuropeFijiFranceGermanyGhanaGreeceGrenadaGuyanaHaitiHondurasHong KongHungaryIndiaIndonesiaIranIraqIrelandIsraelItalyJamaicaJapanJordanKazakhstanKenyaKoreaKuwaitLaosLatin AmericaLatviaLebanonLiberiaLithuaniaMalaysiaMexicoMicronesiaMiddle AfricaMoldovaMoroccoNepalNetherlandsNicaraguaNigeriaNorth AmericaNorth MacedoniaNorthern AfricaNorthern EuropeNorwayOceaniaPakistanPanamaPeruPhilippinesPolandPortugalRomaniaRussiaSaudi ArabiaScotlandSenegalSerbiaSierra LeoneSingaporeSomaliaSouth AfricaSouth AmericaSouth Central AsiaSouth Eastern AsiaSouthern EuropeSpainSri LankaSt. Vincent and the GrenadinesSudanSwedenSwitzerlandSyriaTaiwanThailandTrinidad and TobagoTurkeyUgandaUkraineUruguayUzbekistanVenezuelaVietnamWest IndiesWestern AfricaWestern AsiaWestern EuropeYemenZaireZimbabweAzores
Currently Married
Income
Poverty
Unemployment
Labor Participation
Family Structure
Vehicle Availability
Education Level
Disability

Currently Married Comparison

Immigrants from Guatemala

Immigrants from Pakistan

Tragic
Exceptional
42.6%
CURRENTLY MARRIED
0.0/ 100
METRIC RATING
291st/ 347
METRIC RANK
49.1%
CURRENTLY MARRIED
99.7/ 100
METRIC RATING
23rd/ 347
METRIC RANK

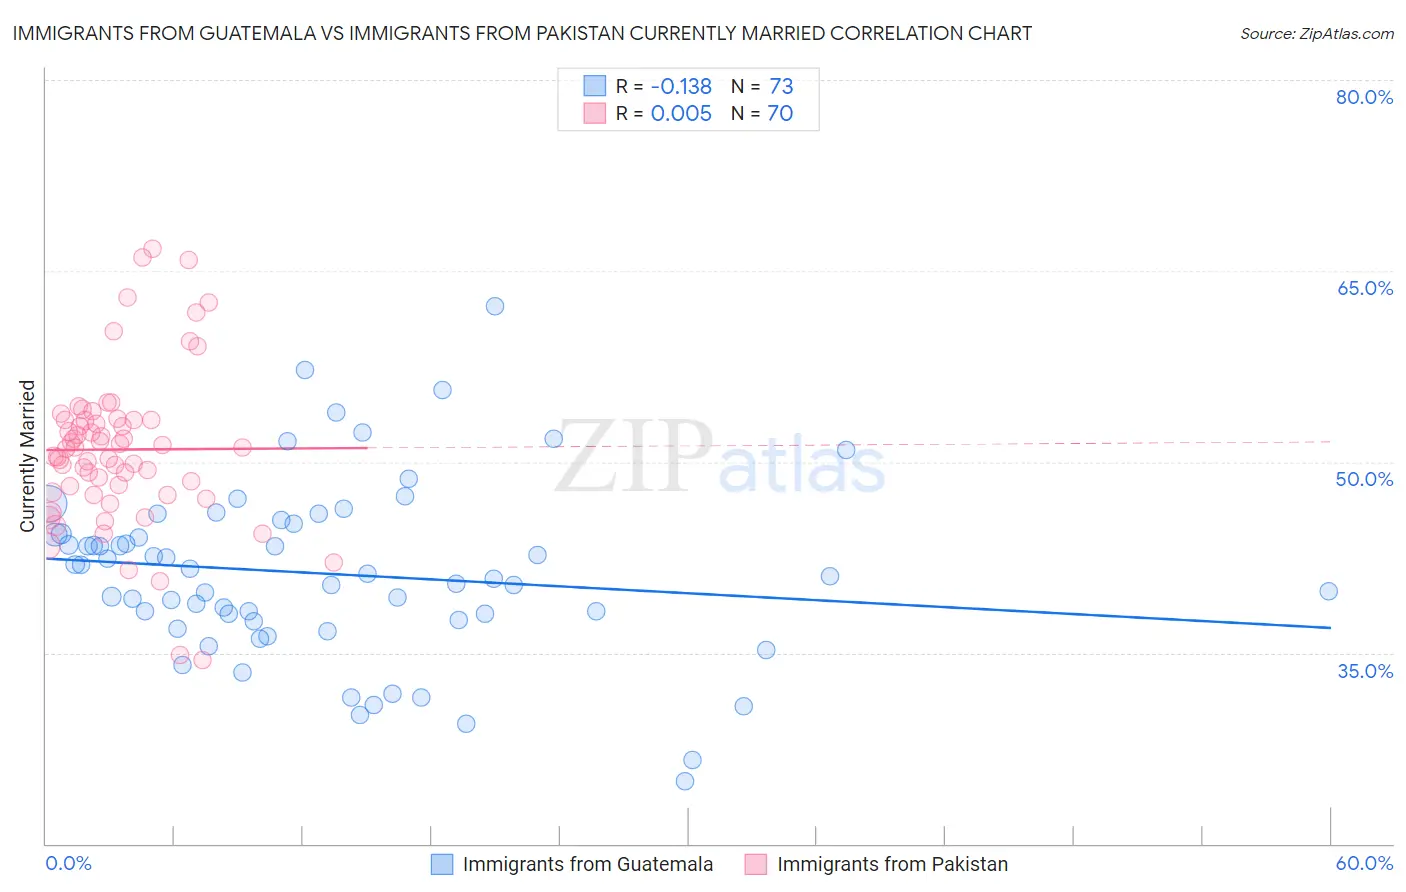
Immigrants from Guatemala vs Immigrants from Pakistan Currently Married Correlation Chart

The statistical analysis conducted on geographies consisting of 377,254,434 people shows a poor negative correlation between the proportion of Immigrants from Guatemala and percentage of population currently married in the United States with a correlation coefficient (R) of -0.138 and weighted average of 42.6%. Similarly, the statistical analysis conducted on geographies consisting of 283,886,869 people shows no correlation between the proportion of Immigrants from Pakistan and percentage of population currently married in the United States with a correlation coefficient (R) of 0.005 and weighted average of 49.1%, a difference of 15.0%.
Immigrants from Guatemala vs Immigrants from Pakistan Currently Married

Currently Married Correlation Summary

MeasurementImmigrants from GuatemalaImmigrants from Pakistan
Minimum24.9%34.4%
Maximum62.2%66.7%
Range37.3%32.3%
Mean41.2%51.0%
Median41.0%51.1%
Interquartile 25% (IQ1)37.6%47.6%
Interquartile 75% (IQ3)44.7%53.3%
Interquartile Range (IQR)7.1%5.7%
Standard Deviation (Sample)6.9%6.2%
Standard Deviation (Population)6.9%6.1%

Similar Demographics by Currently Married

Demographics Similar to Immigrants from Guatemala by Currently Married

In terms of currently married, the demographic groups most similar to Immigrants from Guatemala are Paiute (42.7%, a difference of 0.12%), Immigrants from Ghana (42.7%, a difference of 0.12%), Subsaharan African (42.6%, a difference of 0.16%), Yuman (42.6%, a difference of 0.18%), and Honduran (42.5%, a difference of 0.30%).
DemographicsRating | RankCurrently Married
Immigrants | El Salvador
0.0
/100
|
#284
Tragic
43.1%
Immigrants | Middle Africa
0.0
/100
|
#285
Tragic
43.0%
Ghanaians
0.0
/100
|
#286
Tragic
42.9%
Guatemalans
0.0
/100
|
#287
Tragic
42.9%
Natives/Alaskans
0.0
/100
|
#288
Tragic
42.8%
Paiute
0.0
/100
|
#289
Tragic
42.7%
Immigrants | Ghana
0.0
/100
|
#290
Tragic
42.7%
Immigrants | Guatemala
0.0
/100
|
#291
Tragic
42.6%
Sub-Saharan Africans
0.0
/100
|
#292
Tragic
42.6%
Yuman
0.0
/100
|
#293
Tragic
42.6%
Hondurans
0.0
/100
|
#294
Tragic
42.5%
Immigrants | Western Africa
0.0
/100
|
#295
Tragic
42.4%
Menominee
0.0
/100
|
#296
Tragic
42.3%
Cheyenne
0.0
/100
|
#297
Tragic
42.2%
Immigrants | Honduras
0.0
/100
|
#298
Tragic
42.2%

Demographics Similar to Immigrants from Pakistan by Currently Married

In terms of currently married, the demographic groups most similar to Immigrants from Pakistan are Bulgarian (49.1%, a difference of 0.11%), Lithuanian (49.0%, a difference of 0.11%), Maltese (49.0%, a difference of 0.12%), Immigrants from Korea (49.0%, a difference of 0.17%), and Burmese (48.9%, a difference of 0.24%).
DemographicsRating | RankCurrently Married
Chinese
99.9
/100
|
#16
Exceptional
49.5%
Scandinavians
99.9
/100
|
#17
Exceptional
49.5%
Immigrants | Scotland
99.8
/100
|
#18
Exceptional
49.3%
Europeans
99.8
/100
|
#19
Exceptional
49.3%
Luxembourgers
99.8
/100
|
#20
Exceptional
49.3%
Scottish
99.8
/100
|
#21
Exceptional
49.2%
Bulgarians
99.7
/100
|
#22
Exceptional
49.1%
Immigrants | Pakistan
99.7
/100
|
#23
Exceptional
49.1%
Lithuanians
99.6
/100
|
#24
Exceptional
49.0%
Maltese
99.6
/100
|
#25
Exceptional
49.0%
Immigrants | Korea
99.6
/100
|
#26
Exceptional
49.0%
Burmese
99.6
/100
|
#27
Exceptional
48.9%
Welsh
99.5
/100
|
#28
Exceptional
48.9%
Croatians
99.5
/100
|
#29
Exceptional
48.9%
Eastern Europeans
99.5
/100
|
#30
Exceptional
48.9%