Immigrants from Central America vs Immigrants from Iran Divorced or Separated
COMPARE
Immigrants from Central America
Immigrants from Iran
Divorced or Separated
Divorced or Separated Comparison
Immigrants from Central America
Immigrants from Iran
12.1%
DIVORCED OR SEPARATED
42.9/ 100
METRIC RATING
183rd/ 347
METRIC RANK
10.6%
DIVORCED OR SEPARATED
100.0/ 100
METRIC RATING
18th/ 347
METRIC RANK
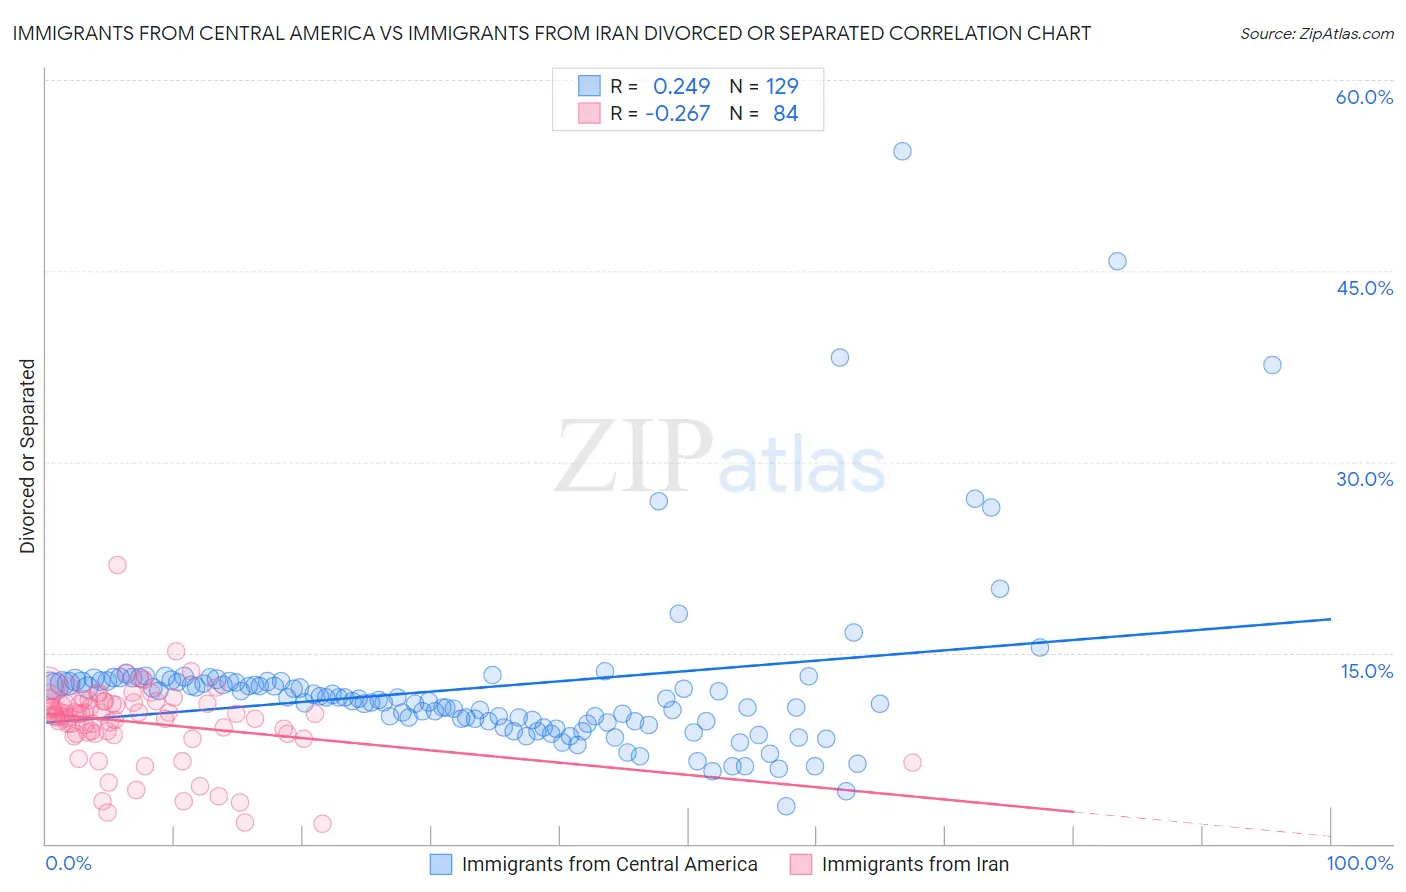
Immigrants from Central America vs Immigrants from Iran Divorced or Separated Correlation Chart
The statistical analysis conducted on geographies consisting of 536,242,690 people shows a weak positive correlation between the proportion of Immigrants from Central America and percentage of population currently divorced or separated in the United States with a correlation coefficient (R) of 0.249 and weighted average of 12.1%. Similarly, the statistical analysis conducted on geographies consisting of 279,868,346 people shows a weak negative correlation between the proportion of Immigrants from Iran and percentage of population currently divorced or separated in the United States with a correlation coefficient (R) of -0.267 and weighted average of 10.6%, a difference of 13.6%.
Divorced or Separated Correlation Summary
| Measurement | Immigrants from Central America | Immigrants from Iran |
| Minimum | 3.0% | 1.6% |
| Maximum | 54.4% | 21.9% |
| Range | 51.4% | 20.3% |
| Mean | 12.2% | 9.5% |
| Median | 11.3% | 10.1% |
| Interquartile 25% (IQ1) | 9.5% | 8.6% |
| Interquartile 75% (IQ3) | 12.7% | 11.1% |
| Interquartile Range (IQR) | 3.2% | 2.5% |
| Standard Deviation (Sample) | 6.8% | 3.1% |
| Standard Deviation (Population) | 6.7% | 3.1% |
Similar Demographics by Divorced or Separated
Demographics Similar to Immigrants from Central America by Divorced or Separated
In terms of divorced or separated, the demographic groups most similar to Immigrants from Central America are Immigrants from Ethiopia (12.1%, a difference of 0.010%), Immigrants from Canada (12.1%, a difference of 0.040%), Immigrants from North America (12.1%, a difference of 0.060%), Barbadian (12.1%, a difference of 0.070%), and Immigrants from Western Europe (12.1%, a difference of 0.090%).
| Demographics | Rating | Rank | Divorced or Separated |
| Pennsylvania Germans | 48.9 /100 | #176 | Average 12.1% |
| Brazilians | 47.7 /100 | #177 | Average 12.1% |
| Ghanaians | 45.9 /100 | #178 | Average 12.1% |
| Immigrants | Western Europe | 45.6 /100 | #179 | Average 12.1% |
| Barbadians | 45.0 /100 | #180 | Average 12.1% |
| Immigrants | Canada | 44.0 /100 | #181 | Average 12.1% |
| Immigrants | Ethiopia | 43.1 /100 | #182 | Average 12.1% |
| Immigrants | Central America | 42.9 /100 | #183 | Average 12.1% |
| Immigrants | North America | 41.1 /100 | #184 | Average 12.1% |
| Immigrants | Nigeria | 40.5 /100 | #185 | Average 12.1% |
| Immigrants | Chile | 39.0 /100 | #186 | Fair 12.1% |
| Belizeans | 37.7 /100 | #187 | Fair 12.1% |
| Immigrants | Belize | 37.6 /100 | #188 | Fair 12.1% |
| Sierra Leoneans | 35.5 /100 | #189 | Fair 12.1% |
| Moroccans | 34.8 /100 | #190 | Fair 12.1% |
Demographics Similar to Immigrants from Iran by Divorced or Separated
In terms of divorced or separated, the demographic groups most similar to Immigrants from Iran are Asian (10.6%, a difference of 0.0%), Immigrants from Israel (10.6%, a difference of 0.090%), Immigrants from Korea (10.6%, a difference of 0.19%), Immigrants from Armenia (10.6%, a difference of 0.63%), and Assyrian/Chaldean/Syriac (10.6%, a difference of 0.70%).
| Demographics | Rating | Rank | Divorced or Separated |
| Immigrants | South Central Asia | 100.0 /100 | #11 | Exceptional 10.4% |
| Okinawans | 100.0 /100 | #12 | Exceptional 10.5% |
| Cypriots | 100.0 /100 | #13 | Exceptional 10.5% |
| Assyrians/Chaldeans/Syriacs | 100.0 /100 | #14 | Exceptional 10.6% |
| Immigrants | Armenia | 100.0 /100 | #15 | Exceptional 10.6% |
| Immigrants | Korea | 100.0 /100 | #16 | Exceptional 10.6% |
| Immigrants | Israel | 100.0 /100 | #17 | Exceptional 10.6% |
| Immigrants | Iran | 100.0 /100 | #18 | Exceptional 10.6% |
| Asians | 100.0 /100 | #19 | Exceptional 10.6% |
| Burmese | 100.0 /100 | #20 | Exceptional 10.7% |
| Immigrants | Asia | 100.0 /100 | #21 | Exceptional 10.7% |
| Vietnamese | 100.0 /100 | #22 | Exceptional 10.8% |
| Immigrants | Pakistan | 100.0 /100 | #23 | Exceptional 10.8% |
| Immigrants | Sri Lanka | 100.0 /100 | #24 | Exceptional 10.8% |
| Iranians | 100.0 /100 | #25 | Exceptional 10.8% |