Czech vs Immigrants from Iran Divorced or Separated
COMPARE
Czech
Immigrants from Iran
Divorced or Separated
Divorced or Separated Comparison
Czechs
Immigrants from Iran
11.9%
DIVORCED OR SEPARATED
76.4/ 100
METRIC RATING
151st/ 347
METRIC RANK
10.6%
DIVORCED OR SEPARATED
100.0/ 100
METRIC RATING
18th/ 347
METRIC RANK
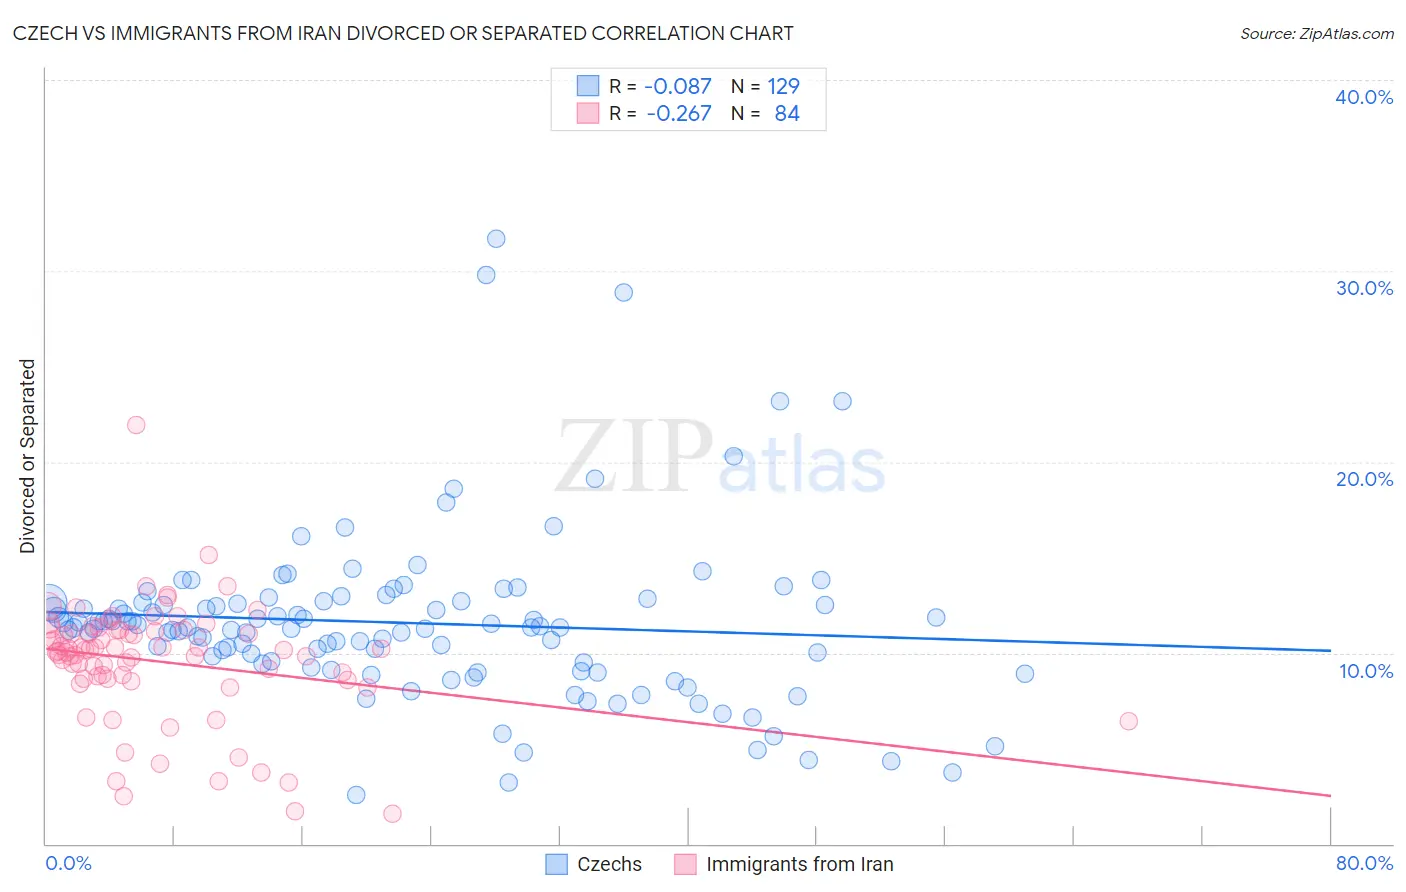
Czech vs Immigrants from Iran Divorced or Separated Correlation Chart
The statistical analysis conducted on geographies consisting of 484,565,083 people shows a slight negative correlation between the proportion of Czechs and percentage of population currently divorced or separated in the United States with a correlation coefficient (R) of -0.087 and weighted average of 11.9%. Similarly, the statistical analysis conducted on geographies consisting of 279,868,346 people shows a weak negative correlation between the proportion of Immigrants from Iran and percentage of population currently divorced or separated in the United States with a correlation coefficient (R) of -0.267 and weighted average of 10.6%, a difference of 12.2%.
Divorced or Separated Correlation Summary
| Measurement | Czech | Immigrants from Iran |
| Minimum | 2.5% | 1.6% |
| Maximum | 31.7% | 21.9% |
| Range | 29.2% | 20.3% |
| Mean | 11.6% | 9.5% |
| Median | 11.3% | 10.1% |
| Interquartile 25% (IQ1) | 9.5% | 8.6% |
| Interquartile 75% (IQ3) | 12.7% | 11.1% |
| Interquartile Range (IQR) | 3.2% | 2.5% |
| Standard Deviation (Sample) | 4.4% | 3.1% |
| Standard Deviation (Population) | 4.4% | 3.1% |
Similar Demographics by Divorced or Separated
Demographics Similar to Czechs by Divorced or Separated
In terms of divorced or separated, the demographic groups most similar to Czechs are Immigrants from Portugal (11.9%, a difference of 0.040%), Immigrants from Oceania (11.9%, a difference of 0.060%), Italian (11.9%, a difference of 0.070%), Polish (11.9%, a difference of 0.11%), and Immigrants from Hungary (11.9%, a difference of 0.13%).
| Demographics | Rating | Rank | Divorced or Separated |
| Peruvians | 80.9 /100 | #144 | Excellent 11.9% |
| Croatians | 80.6 /100 | #145 | Excellent 11.9% |
| Immigrants | Grenada | 79.1 /100 | #146 | Good 11.9% |
| Poles | 78.6 /100 | #147 | Good 11.9% |
| Italians | 77.8 /100 | #148 | Good 11.9% |
| Immigrants | Oceania | 77.7 /100 | #149 | Good 11.9% |
| Immigrants | Portugal | 77.3 /100 | #150 | Good 11.9% |
| Czechs | 76.4 /100 | #151 | Good 11.9% |
| Immigrants | Hungary | 73.7 /100 | #152 | Good 11.9% |
| Austrians | 72.2 /100 | #153 | Good 12.0% |
| Chileans | 71.3 /100 | #154 | Good 12.0% |
| Japanese | 70.9 /100 | #155 | Good 12.0% |
| Hungarians | 70.3 /100 | #156 | Good 12.0% |
| Immigrants | Brazil | 68.8 /100 | #157 | Good 12.0% |
| Icelanders | 66.0 /100 | #158 | Good 12.0% |
Demographics Similar to Immigrants from Iran by Divorced or Separated
In terms of divorced or separated, the demographic groups most similar to Immigrants from Iran are Asian (10.6%, a difference of 0.0%), Immigrants from Israel (10.6%, a difference of 0.090%), Immigrants from Korea (10.6%, a difference of 0.19%), Immigrants from Armenia (10.6%, a difference of 0.63%), and Assyrian/Chaldean/Syriac (10.6%, a difference of 0.70%).
| Demographics | Rating | Rank | Divorced or Separated |
| Immigrants | South Central Asia | 100.0 /100 | #11 | Exceptional 10.4% |
| Okinawans | 100.0 /100 | #12 | Exceptional 10.5% |
| Cypriots | 100.0 /100 | #13 | Exceptional 10.5% |
| Assyrians/Chaldeans/Syriacs | 100.0 /100 | #14 | Exceptional 10.6% |
| Immigrants | Armenia | 100.0 /100 | #15 | Exceptional 10.6% |
| Immigrants | Korea | 100.0 /100 | #16 | Exceptional 10.6% |
| Immigrants | Israel | 100.0 /100 | #17 | Exceptional 10.6% |
| Immigrants | Iran | 100.0 /100 | #18 | Exceptional 10.6% |
| Asians | 100.0 /100 | #19 | Exceptional 10.6% |
| Burmese | 100.0 /100 | #20 | Exceptional 10.7% |
| Immigrants | Asia | 100.0 /100 | #21 | Exceptional 10.7% |
| Vietnamese | 100.0 /100 | #22 | Exceptional 10.8% |
| Immigrants | Pakistan | 100.0 /100 | #23 | Exceptional 10.8% |
| Immigrants | Sri Lanka | 100.0 /100 | #24 | Exceptional 10.8% |
| Iranians | 100.0 /100 | #25 | Exceptional 10.8% |