Immigrants from Central America vs Immigrants from Iran Child Poverty Under the Age of 16

COMPARE

Immigrants from Central America
Race
Ancestry
AfghanAfricanAlaska NativeAlaskan AthabascanAlbanianAleutAlsatianAmericanApacheArabArapahoArgentineanArmenianAssyrian/Chaldean/SyriacAustralianAustrianBahamianBangladeshiBarbadianBasqueBelgianBelizeanBermudanBhutaneseBlackfeetBolivianBrazilianBritishBritish West IndianBulgarianBurmeseCajunCambodianCanadianCape VerdeanCarpatho RusynCelticCentral AmericanCentral American IndianCherokeeCheyenneChickasawChileanChineseChippewaChoctawColombianColvilleComancheCosta RicanCreeCreekCroatianCrowCubanCypriotCzechCzechoslovakianDanishDelawareDominicanDutchDutch West IndianEastern EuropeanEcuadorianEgyptianEnglishEstonianEthiopianEuropeanFijianFilipinoFinnishFrenchFrench American IndianFrench CanadianGermanGerman RussianGhanaianGreekGuamanian/ChamorroGuatemalanGuyaneseHaitianHmongHonduranHopiHoumaHungarianIcelanderIndian (Asian)IndonesianInupiatIranianIraqiIrishIroquoisIsraeliItalianJamaicanJapaneseJordanianKenyanKiowaKoreanLaotianLatvianLebaneseLiberianLithuanianLumbeeLuxembourgerMacedonianMalaysianMalteseMarshalleseMenomineeMexicanMexican American IndianMongolianMoroccanNative HawaiianNavajoNepaleseNew ZealanderNicaraguanNigerianNorthern EuropeanNorwegianOkinawanOsageOttawaPaiutePakistaniPalestinianPanamanianParaguayanPennsylvania GermanPeruvianPimaPolishPortuguesePotawatomiPuebloPuerto RicanPuget Sound SalishRomanianRussianSalvadoranSamoanScandinavianScotch-IrishScottishSeminoleSenegaleseSerbianShoshoneSierra LeoneanSiouxSlavicSlovakSloveneSomaliSouth AfricanSouth AmericanSouth American IndianSoviet UnionSpaniardSpanishSpanish AmericanSpanish American IndianSri LankanSubsaharan AfricanSudaneseSwedishSwissSyrianTaiwaneseThaiTlingit-HaidaTohono O'OdhamTonganTrinidadian and TobagonianTsimshianTurkishU.S. Virgin IslanderUgandanUkrainianUruguayanUteVenezuelanVietnameseWelshWest IndianYakamaYaquiYugoslavianYumanYup'ikZimbabwean
Immigration
NonimmigrantsImmigrantsAfghanistanAfricaAlbaniaArgentinaArmeniaAsiaAustraliaAustriaBahamasBangladeshBarbadosBelarusBelgiumBelizeBoliviaBosnia and HerzegovinaBrazilBulgariaBurma/MyanmarCabo VerdeCambodiaCameroonCanadaCaribbeanCentral AmericaChileChinaColombiaCongoCosta RicaCroatiaCubaCzechoslovakiaDenmarkDominicaDominican RepublicEastern AfricaEastern AsiaEastern EuropeEcuadorEgyptEl SalvadorEnglandEritreaEthiopiaEuropeFijiFranceGermanyGhanaGreeceGrenadaGuatemalaGuyanaHaitiHondurasHong KongHungaryIndiaIndonesiaIraqIrelandIsraelItalyJamaicaJapanJordanKazakhstanKenyaKoreaKuwaitLaosLatin AmericaLatviaLebanonLiberiaLithuaniaMalaysiaMexicoMicronesiaMiddle AfricaMoldovaMoroccoNepalNetherlandsNicaraguaNigeriaNorth AmericaNorth MacedoniaNorthern AfricaNorthern EuropeNorwayOceaniaPakistanPanamaPeruPhilippinesPolandPortugalRomaniaRussiaSaudi ArabiaScotlandSenegalSerbiaSierra LeoneSingaporeSomaliaSouth AfricaSouth AmericaSouth Central AsiaSouth Eastern AsiaSouthern EuropeSpainSri LankaSt. Vincent and the GrenadinesSudanSwedenSwitzerlandSyriaTaiwanThailandTrinidad and TobagoTurkeyUgandaUkraineUruguayUzbekistanVenezuelaVietnamWest IndiesWestern AfricaWestern AsiaWestern EuropeYemenZaireZimbabweAzores
Immigrants from Iran
Race
Ancestry
AfghanAfricanAlaska NativeAlaskan AthabascanAlbanianAleutAlsatianAmericanApacheArabArapahoArgentineanArmenianAssyrian/Chaldean/SyriacAustralianAustrianBahamianBangladeshiBarbadianBasqueBelgianBelizeanBermudanBhutaneseBlackfeetBolivianBrazilianBritishBritish West IndianBulgarianBurmeseCajunCambodianCanadianCape VerdeanCarpatho RusynCelticCentral AmericanCentral American IndianCherokeeCheyenneChickasawChileanChineseChippewaChoctawColombianColvilleComancheCosta RicanCreeCreekCroatianCrowCubanCypriotCzechCzechoslovakianDanishDelawareDominicanDutchDutch West IndianEastern EuropeanEcuadorianEgyptianEnglishEstonianEthiopianEuropeanFijianFilipinoFinnishFrenchFrench American IndianFrench CanadianGermanGerman RussianGhanaianGreekGuamanian/ChamorroGuatemalanGuyaneseHaitianHmongHonduranHopiHoumaHungarianIcelanderIndian (Asian)IndonesianInupiatIranianIraqiIrishIroquoisIsraeliItalianJamaicanJapaneseJordanianKenyanKiowaKoreanLaotianLatvianLebaneseLiberianLithuanianLumbeeLuxembourgerMacedonianMalaysianMalteseMarshalleseMenomineeMexicanMexican American IndianMongolianMoroccanNative HawaiianNavajoNepaleseNew ZealanderNicaraguanNigerianNorthern EuropeanNorwegianOkinawanOsageOttawaPaiutePakistaniPalestinianPanamanianParaguayanPennsylvania GermanPeruvianPimaPolishPortuguesePotawatomiPuebloPuerto RicanPuget Sound SalishRomanianRussianSalvadoranSamoanScandinavianScotch-IrishScottishSeminoleSenegaleseSerbianShoshoneSierra LeoneanSiouxSlavicSlovakSloveneSomaliSouth AfricanSouth AmericanSouth American IndianSoviet UnionSpaniardSpanishSpanish AmericanSpanish American IndianSri LankanSubsaharan AfricanSudaneseSwedishSwissSyrianTaiwaneseThaiTlingit-HaidaTohono O'OdhamTonganTrinidadian and TobagonianTsimshianTurkishU.S. Virgin IslanderUgandanUkrainianUruguayanUteVenezuelanVietnameseWelshWest IndianYakamaYaquiYugoslavianYumanYup'ikZimbabwean
Immigration
NonimmigrantsImmigrantsAfghanistanAfricaAlbaniaArgentinaArmeniaAsiaAustraliaAustriaBahamasBangladeshBarbadosBelarusBelgiumBelizeBoliviaBosnia and HerzegovinaBrazilBulgariaBurma/MyanmarCabo VerdeCambodiaCameroonCanadaCaribbeanChileChinaColombiaCongoCosta RicaCroatiaCubaCzechoslovakiaDenmarkDominicaDominican RepublicEastern AfricaEastern AsiaEastern EuropeEcuadorEgyptEl SalvadorEnglandEritreaEthiopiaEuropeFijiFranceGermanyGhanaGreeceGrenadaGuatemalaGuyanaHaitiHondurasHong KongHungaryIndiaIndonesiaIranIraqIrelandIsraelItalyJamaicaJapanJordanKazakhstanKenyaKoreaKuwaitLaosLatin AmericaLatviaLebanonLiberiaLithuaniaMalaysiaMexicoMicronesiaMiddle AfricaMoldovaMoroccoNepalNetherlandsNicaraguaNigeriaNorth AmericaNorth MacedoniaNorthern AfricaNorthern EuropeNorwayOceaniaPakistanPanamaPeruPhilippinesPolandPortugalRomaniaRussiaSaudi ArabiaScotlandSenegalSerbiaSierra LeoneSingaporeSomaliaSouth AfricaSouth AmericaSouth Central AsiaSouth Eastern AsiaSouthern EuropeSpainSri LankaSt. Vincent and the GrenadinesSudanSwedenSwitzerlandSyriaTaiwanThailandTrinidad and TobagoTurkeyUgandaUkraineUruguayUzbekistanVenezuelaVietnamWest IndiesWestern AfricaWestern AsiaWestern EuropeYemenZaireZimbabweAzores
Child Poverty Under the Age of 16
Income
Poverty
Unemployment
Labor Participation
Family Structure
Vehicle Availability
Education Level
Disability

Child Poverty Under the Age of 16 Comparison

Immigrants from Central America

Immigrants from Iran

Tragic
Exceptional
21.3%
CHILD POVERTY UNDER THE AGE OF 16
0.0/ 100
METRIC RATING
307th/ 347
METRIC RANK
12.4%
CHILD POVERTY UNDER THE AGE OF 16
100.0/ 100
METRIC RATING
9th/ 347
METRIC RANK

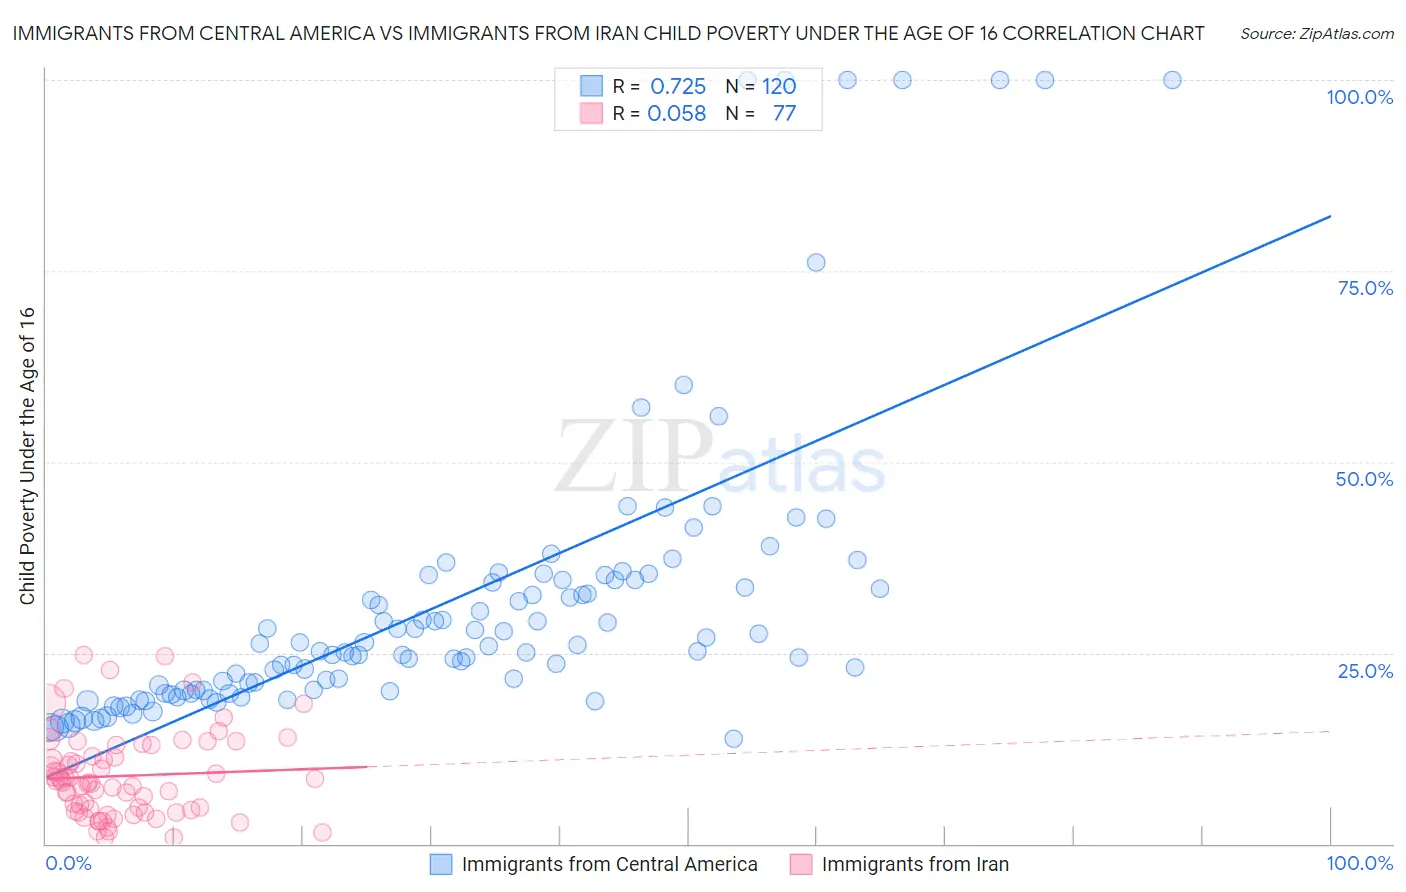
Immigrants from Central America vs Immigrants from Iran Child Poverty Under the Age of 16 Correlation Chart

The statistical analysis conducted on geographies consisting of 528,817,501 people shows a strong positive correlation between the proportion of Immigrants from Central America and poverty level among children under the age of 16 in the United States with a correlation coefficient (R) of 0.725 and weighted average of 21.3%. Similarly, the statistical analysis conducted on geographies consisting of 277,819,095 people shows a slight positive correlation between the proportion of Immigrants from Iran and poverty level among children under the age of 16 in the United States with a correlation coefficient (R) of 0.058 and weighted average of 12.4%, a difference of 71.7%.
Immigrants from Central America vs Immigrants from Iran Child Poverty Under the Age of 16

Child Poverty Under the Age of 16 Correlation Summary

MeasurementImmigrants from Central AmericaImmigrants from Iran
Minimum13.8%0.81%
Maximum100.0%24.8%
Range86.2%24.0%
Mean31.6%8.9%
Median25.5%8.0%
Interquartile 25% (IQ1)20.1%4.4%
Interquartile 75% (IQ3)34.5%12.2%
Interquartile Range (IQR)14.4%7.8%
Standard Deviation (Sample)19.7%5.6%
Standard Deviation (Population)19.6%5.5%

Similar Demographics by Child Poverty Under the Age of 16

Demographics Similar to Immigrants from Central America by Child Poverty Under the Age of 16

In terms of child poverty under the age of 16, the demographic groups most similar to Immigrants from Central America are British West Indian (21.3%, a difference of 0.29%), Guatemalan (21.2%, a difference of 0.41%), Seminole (21.1%, a difference of 0.57%), Immigrants from Mexico (21.5%, a difference of 0.94%), and Bahamian (21.5%, a difference of 0.96%).
DemographicsRating | RankChild Poverty Under the Age of 16
Indonesians
0.0
/100
|
#300
Tragic
21.0%
Immigrants | Grenada
0.0
/100
|
#301
Tragic
21.0%
Immigrants | Bahamas
0.0
/100
|
#302
Tragic
21.0%
Choctaw
0.0
/100
|
#303
Tragic
21.0%
Somalis
0.0
/100
|
#304
Tragic
21.0%
Seminole
0.0
/100
|
#305
Tragic
21.1%
Guatemalans
0.0
/100
|
#306
Tragic
21.2%
Immigrants | Central America
0.0
/100
|
#307
Tragic
21.3%
British West Indians
0.0
/100
|
#308
Tragic
21.3%
Immigrants | Mexico
0.0
/100
|
#309
Tragic
21.5%
Bahamians
0.0
/100
|
#310
Tragic
21.5%
Dutch West Indians
0.0
/100
|
#311
Tragic
21.5%
Ute
0.0
/100
|
#312
Tragic
21.5%
Creek
0.0
/100
|
#313
Tragic
21.5%
Immigrants | Somalia
0.0
/100
|
#314
Tragic
21.6%

Demographics Similar to Immigrants from Iran by Child Poverty Under the Age of 16

In terms of child poverty under the age of 16, the demographic groups most similar to Immigrants from Iran are Immigrants from Singapore (12.4%, a difference of 0.11%), Immigrants from South Central Asia (12.5%, a difference of 1.2%), Bhutanese (12.5%, a difference of 1.2%), Iranian (12.2%, a difference of 1.2%), and Immigrants from Hong Kong (12.1%, a difference of 2.0%).
DemographicsRating | RankChild Poverty Under the Age of 16
Immigrants | Taiwan
100.0
/100
|
#2
Exceptional
11.0%
Filipinos
100.0
/100
|
#3
Exceptional
11.1%
Thais
100.0
/100
|
#4
Exceptional
11.6%
Chinese
100.0
/100
|
#5
Exceptional
11.9%
Immigrants | Hong Kong
100.0
/100
|
#6
Exceptional
12.1%
Iranians
100.0
/100
|
#7
Exceptional
12.2%
Immigrants | Singapore
100.0
/100
|
#8
Exceptional
12.4%
Immigrants | Iran
100.0
/100
|
#9
Exceptional
12.4%
Immigrants | South Central Asia
99.9
/100
|
#10
Exceptional
12.5%
Bhutanese
99.9
/100
|
#11
Exceptional
12.5%
Immigrants | Ireland
99.9
/100
|
#12
Exceptional
12.7%
Burmese
99.9
/100
|
#13
Exceptional
12.8%
Immigrants | Lithuania
99.9
/100
|
#14
Exceptional
12.9%
Immigrants | Korea
99.9
/100
|
#15
Exceptional
13.0%
Norwegians
99.9
/100
|
#16
Exceptional
13.0%