Immigrants from Belgium vs Iroquois Family Households with Children
COMPARE
Immigrants from Belgium
Iroquois
Family Households with Children
Family Households with Children Comparison
Immigrants from Belgium
Iroquois
26.7%
FAMILY HOUSEHOLDS WITH CHILDREN
0.9/ 100
METRIC RATING
268th/ 347
METRIC RANK
26.1%
FAMILY HOUSEHOLDS WITH CHILDREN
0.0/ 100
METRIC RATING
318th/ 347
METRIC RANK
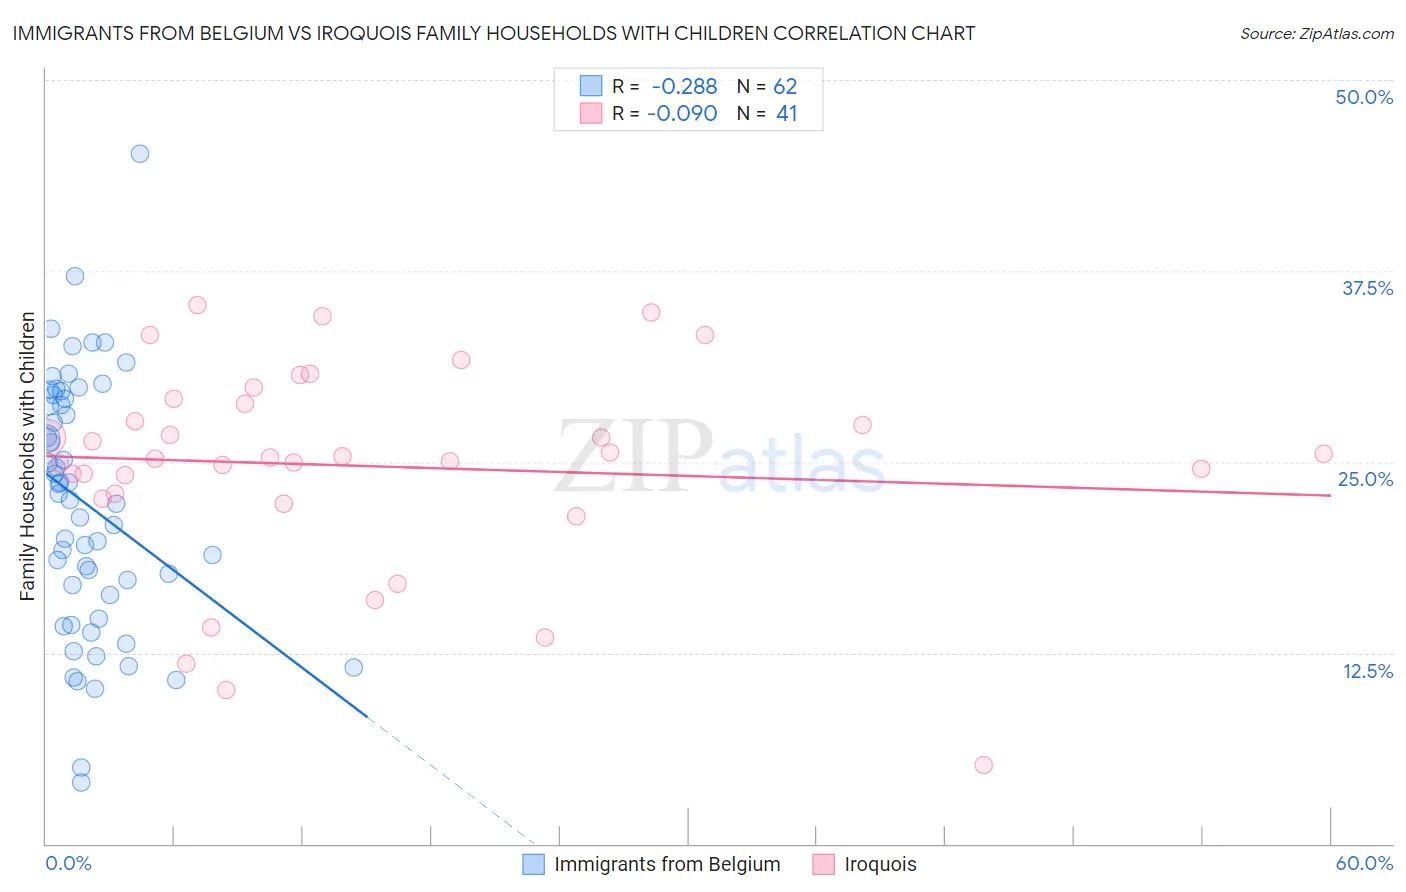
Immigrants from Belgium vs Iroquois Family Households with Children Correlation Chart
The statistical analysis conducted on geographies consisting of 146,676,152 people shows a weak negative correlation between the proportion of Immigrants from Belgium and percentage of family households with children in the United States with a correlation coefficient (R) of -0.288 and weighted average of 26.7%. Similarly, the statistical analysis conducted on geographies consisting of 207,224,284 people shows a slight negative correlation between the proportion of Iroquois and percentage of family households with children in the United States with a correlation coefficient (R) of -0.090 and weighted average of 26.1%, a difference of 2.6%.
Family Households with Children Correlation Summary
| Measurement | Immigrants from Belgium | Iroquois |
| Minimum | 4.0% | 5.2% |
| Maximum | 45.1% | 35.2% |
| Range | 41.1% | 30.1% |
| Mean | 22.2% | 24.7% |
| Median | 22.7% | 25.3% |
| Interquartile 25% (IQ1) | 16.3% | 22.7% |
| Interquartile 75% (IQ3) | 29.1% | 29.0% |
| Interquartile Range (IQR) | 12.8% | 6.2% |
| Standard Deviation (Sample) | 8.3% | 6.8% |
| Standard Deviation (Population) | 8.2% | 6.7% |
Similar Demographics by Family Households with Children
Demographics Similar to Immigrants from Belgium by Family Households with Children
In terms of family households with children, the demographic groups most similar to Immigrants from Belgium are Maltese (26.7%, a difference of 0.010%), Immigrants from Uzbekistan (26.7%, a difference of 0.010%), Taiwanese (26.7%, a difference of 0.020%), Chippewa (26.7%, a difference of 0.020%), and Immigrants from Denmark (26.7%, a difference of 0.040%).
| Demographics | Rating | Rank | Family Households with Children |
| Immigrants | Belarus | 1.1 /100 | #261 | Tragic 26.8% |
| Immigrants | Russia | 1.0 /100 | #262 | Tragic 26.8% |
| Immigrants | North Macedonia | 1.0 /100 | #263 | Tragic 26.7% |
| Taiwanese | 0.9 /100 | #264 | Tragic 26.7% |
| Chippewa | 0.9 /100 | #265 | Tragic 26.7% |
| Maltese | 0.9 /100 | #266 | Tragic 26.7% |
| Immigrants | Uzbekistan | 0.9 /100 | #267 | Tragic 26.7% |
| Immigrants | Belgium | 0.9 /100 | #268 | Tragic 26.7% |
| Immigrants | Denmark | 0.8 /100 | #269 | Tragic 26.7% |
| Immigrants | Zaire | 0.7 /100 | #270 | Tragic 26.7% |
| French | 0.7 /100 | #271 | Tragic 26.7% |
| Somalis | 0.7 /100 | #272 | Tragic 26.7% |
| Immigrants | Hungary | 0.6 /100 | #273 | Tragic 26.7% |
| Eastern Europeans | 0.6 /100 | #274 | Tragic 26.7% |
| Immigrants | Northern Europe | 0.5 /100 | #275 | Tragic 26.7% |
Demographics Similar to Iroquois by Family Households with Children
In terms of family households with children, the demographic groups most similar to Iroquois are Ottawa (26.1%, a difference of 0.050%), Immigrants from France (26.0%, a difference of 0.090%), Tlingit-Haida (26.0%, a difference of 0.10%), British West Indian (26.0%, a difference of 0.12%), and Estonian (26.1%, a difference of 0.13%).
| Demographics | Rating | Rank | Family Households with Children |
| Colville | 0.0 /100 | #311 | Tragic 26.2% |
| Immigrants | Czechoslovakia | 0.0 /100 | #312 | Tragic 26.2% |
| Cree | 0.0 /100 | #313 | Tragic 26.2% |
| French Canadians | 0.0 /100 | #314 | Tragic 26.1% |
| Immigrants | Norway | 0.0 /100 | #315 | Tragic 26.1% |
| Estonians | 0.0 /100 | #316 | Tragic 26.1% |
| Ottawa | 0.0 /100 | #317 | Tragic 26.1% |
| Iroquois | 0.0 /100 | #318 | Tragic 26.1% |
| Immigrants | France | 0.0 /100 | #319 | Tragic 26.0% |
| Tlingit-Haida | 0.0 /100 | #320 | Tragic 26.0% |
| British West Indians | 0.0 /100 | #321 | Tragic 26.0% |
| Immigrants | Greece | 0.0 /100 | #322 | Tragic 26.0% |
| Immigrants | Australia | 0.0 /100 | #323 | Tragic 26.0% |
| Chinese | 0.0 /100 | #324 | Tragic 26.0% |
| Barbadians | 0.0 /100 | #325 | Tragic 26.0% |