Hmong vs Tongan Average Family Size

COMPARE

Hmong
Race
Ancestry
AfghanAfricanAlaska NativeAlaskan AthabascanAlbanianAleutAlsatianAmericanApacheArabArapahoArgentineanArmenianAssyrian/Chaldean/SyriacAustralianAustrianBahamianBangladeshiBarbadianBasqueBelgianBelizeanBermudanBhutaneseBlackfeetBolivianBrazilianBritishBritish West IndianBulgarianBurmeseCajunCambodianCanadianCape VerdeanCarpatho RusynCelticCentral AmericanCentral American IndianCherokeeCheyenneChickasawChileanChineseChippewaChoctawColombianColvilleComancheCosta RicanCreeCreekCroatianCrowCubanCypriotCzechCzechoslovakianDanishDelawareDominicanDutchDutch West IndianEastern EuropeanEcuadorianEgyptianEnglishEstonianEthiopianEuropeanFijianFilipinoFinnishFrenchFrench American IndianFrench CanadianGermanGerman RussianGhanaianGreekGuamanian/ChamorroGuatemalanGuyaneseHaitianHmongHonduranHopiHoumaHungarianIcelanderIndian (Asian)IndonesianInupiatIranianIraqiIrishIroquoisIsraeliItalianJamaicanJapaneseJordanianKenyanKiowaKoreanLaotianLatvianLebaneseLiberianLithuanianLumbeeLuxembourgerMacedonianMalaysianMalteseMarshalleseMenomineeMexicanMexican American IndianMongolianMoroccanNative HawaiianNavajoNepaleseNew ZealanderNicaraguanNigerianNorthern EuropeanNorwegianOkinawanOsageOttawaPaiutePakistaniPalestinianPanamanianParaguayanPennsylvania GermanPeruvianPimaPolishPortuguesePotawatomiPuebloPuerto RicanPuget Sound SalishRomanianRussianSalvadoranSamoanScandinavianScotch-IrishScottishSeminoleSenegaleseSerbianShoshoneSierra LeoneanSiouxSlavicSlovakSloveneSomaliSouth AfricanSouth AmericanSouth American IndianSoviet UnionSpaniardSpanishSpanish AmericanSpanish American IndianSri LankanSubsaharan AfricanSudaneseSwedishSwissSyrianTaiwaneseThaiTlingit-HaidaTohono O'OdhamTrinidadian and TobagonianTsimshianTurkishU.S. Virgin IslanderUgandanUkrainianUruguayanUteVenezuelanVietnameseWelshWest IndianYakamaYaquiYugoslavianYumanYup'ikZimbabwean
Immigration
NonimmigrantsImmigrantsAfghanistanAfricaAlbaniaArgentinaArmeniaAsiaAustraliaAustriaBahamasBangladeshBarbadosBelarusBelgiumBelizeBoliviaBosnia and HerzegovinaBrazilBulgariaBurma/MyanmarCabo VerdeCambodiaCameroonCanadaCaribbeanCentral AmericaChileChinaColombiaCongoCosta RicaCroatiaCubaCzechoslovakiaDenmarkDominicaDominican RepublicEastern AfricaEastern AsiaEastern EuropeEcuadorEgyptEl SalvadorEnglandEritreaEthiopiaEuropeFijiFranceGermanyGhanaGreeceGrenadaGuatemalaGuyanaHaitiHondurasHong KongHungaryIndiaIndonesiaIranIraqIrelandIsraelItalyJamaicaJapanJordanKazakhstanKenyaKoreaKuwaitLaosLatin AmericaLatviaLebanonLiberiaLithuaniaMalaysiaMexicoMicronesiaMiddle AfricaMoldovaMoroccoNepalNetherlandsNicaraguaNigeriaNorth AmericaNorth MacedoniaNorthern AfricaNorthern EuropeNorwayOceaniaPakistanPanamaPeruPhilippinesPolandPortugalRomaniaRussiaSaudi ArabiaScotlandSenegalSerbiaSierra LeoneSingaporeSomaliaSouth AfricaSouth AmericaSouth Central AsiaSouth Eastern AsiaSouthern EuropeSpainSri LankaSt. Vincent and the GrenadinesSudanSwedenSwitzerlandSyriaTaiwanThailandTrinidad and TobagoTurkeyUgandaUkraineUruguayUzbekistanVenezuelaVietnamWest IndiesWestern AfricaWestern AsiaWestern EuropeYemenZaireZimbabweAzores
Tongan
Race
Ancestry
AfghanAfricanAlaska NativeAlaskan AthabascanAlbanianAleutAlsatianAmericanApacheArabArapahoArgentineanArmenianAssyrian/Chaldean/SyriacAustralianAustrianBahamianBangladeshiBarbadianBasqueBelgianBelizeanBermudanBhutaneseBlackfeetBolivianBrazilianBritishBritish West IndianBulgarianBurmeseCajunCambodianCanadianCape VerdeanCarpatho RusynCelticCentral AmericanCentral American IndianCherokeeCheyenneChickasawChileanChineseChippewaChoctawColombianColvilleComancheCosta RicanCreeCreekCroatianCrowCubanCypriotCzechCzechoslovakianDanishDelawareDominicanDutchDutch West IndianEastern EuropeanEcuadorianEgyptianEnglishEstonianEthiopianEuropeanFijianFilipinoFinnishFrenchFrench American IndianFrench CanadianGermanGerman RussianGhanaianGreekGuamanian/ChamorroGuatemalanGuyaneseHaitianHonduranHopiHoumaHungarianIcelanderIndian (Asian)IndonesianInupiatIranianIraqiIrishIroquoisIsraeliItalianJamaicanJapaneseJordanianKenyanKiowaKoreanLaotianLatvianLebaneseLiberianLithuanianLumbeeLuxembourgerMacedonianMalaysianMalteseMarshalleseMenomineeMexicanMexican American IndianMongolianMoroccanNative HawaiianNavajoNepaleseNew ZealanderNicaraguanNigerianNorthern EuropeanNorwegianOkinawanOsageOttawaPaiutePakistaniPalestinianPanamanianParaguayanPennsylvania GermanPeruvianPimaPolishPortuguesePotawatomiPuebloPuerto RicanPuget Sound SalishRomanianRussianSalvadoranSamoanScandinavianScotch-IrishScottishSeminoleSenegaleseSerbianShoshoneSierra LeoneanSiouxSlavicSlovakSloveneSomaliSouth AfricanSouth AmericanSouth American IndianSoviet UnionSpaniardSpanishSpanish AmericanSpanish American IndianSri LankanSubsaharan AfricanSudaneseSwedishSwissSyrianTaiwaneseThaiTlingit-HaidaTohono O'OdhamTonganTrinidadian and TobagonianTsimshianTurkishU.S. Virgin IslanderUgandanUkrainianUruguayanUteVenezuelanVietnameseWelshWest IndianYakamaYaquiYugoslavianYumanYup'ikZimbabwean
Immigration
NonimmigrantsImmigrantsAfghanistanAfricaAlbaniaArgentinaArmeniaAsiaAustraliaAustriaBahamasBangladeshBarbadosBelarusBelgiumBelizeBoliviaBosnia and HerzegovinaBrazilBulgariaBurma/MyanmarCabo VerdeCambodiaCameroonCanadaCaribbeanCentral AmericaChileChinaColombiaCongoCosta RicaCroatiaCubaCzechoslovakiaDenmarkDominicaDominican RepublicEastern AfricaEastern AsiaEastern EuropeEcuadorEgyptEl SalvadorEnglandEritreaEthiopiaEuropeFijiFranceGermanyGhanaGreeceGrenadaGuatemalaGuyanaHaitiHondurasHong KongHungaryIndiaIndonesiaIranIraqIrelandIsraelItalyJamaicaJapanJordanKazakhstanKenyaKoreaKuwaitLaosLatin AmericaLatviaLebanonLiberiaLithuaniaMalaysiaMexicoMicronesiaMiddle AfricaMoldovaMoroccoNepalNetherlandsNicaraguaNigeriaNorth AmericaNorth MacedoniaNorthern AfricaNorthern EuropeNorwayOceaniaPakistanPanamaPeruPhilippinesPolandPortugalRomaniaRussiaSaudi ArabiaScotlandSenegalSerbiaSierra LeoneSingaporeSomaliaSouth AfricaSouth AmericaSouth Central AsiaSouth Eastern AsiaSouthern EuropeSpainSri LankaSt. Vincent and the GrenadinesSudanSwedenSwitzerlandSyriaTaiwanThailandTrinidad and TobagoTurkeyUgandaUkraineUruguayUzbekistanVenezuelaVietnamWest IndiesWestern AfricaWestern AsiaWestern EuropeYemenZaireZimbabweAzores
Average Family Size
Income
Poverty
Unemployment
Labor Participation
Family Structure
Vehicle Availability
Education Level
Disability

Average Family Size Comparison

Hmong

Tongans

Fair
Exceptional
3.21
AVERAGE FAMILY SIZE
20.7/ 100
METRIC RATING
199th/ 347
METRIC RANK
3.49
AVERAGE FAMILY SIZE
100.0/ 100
METRIC RATING
15th/ 347
METRIC RANK

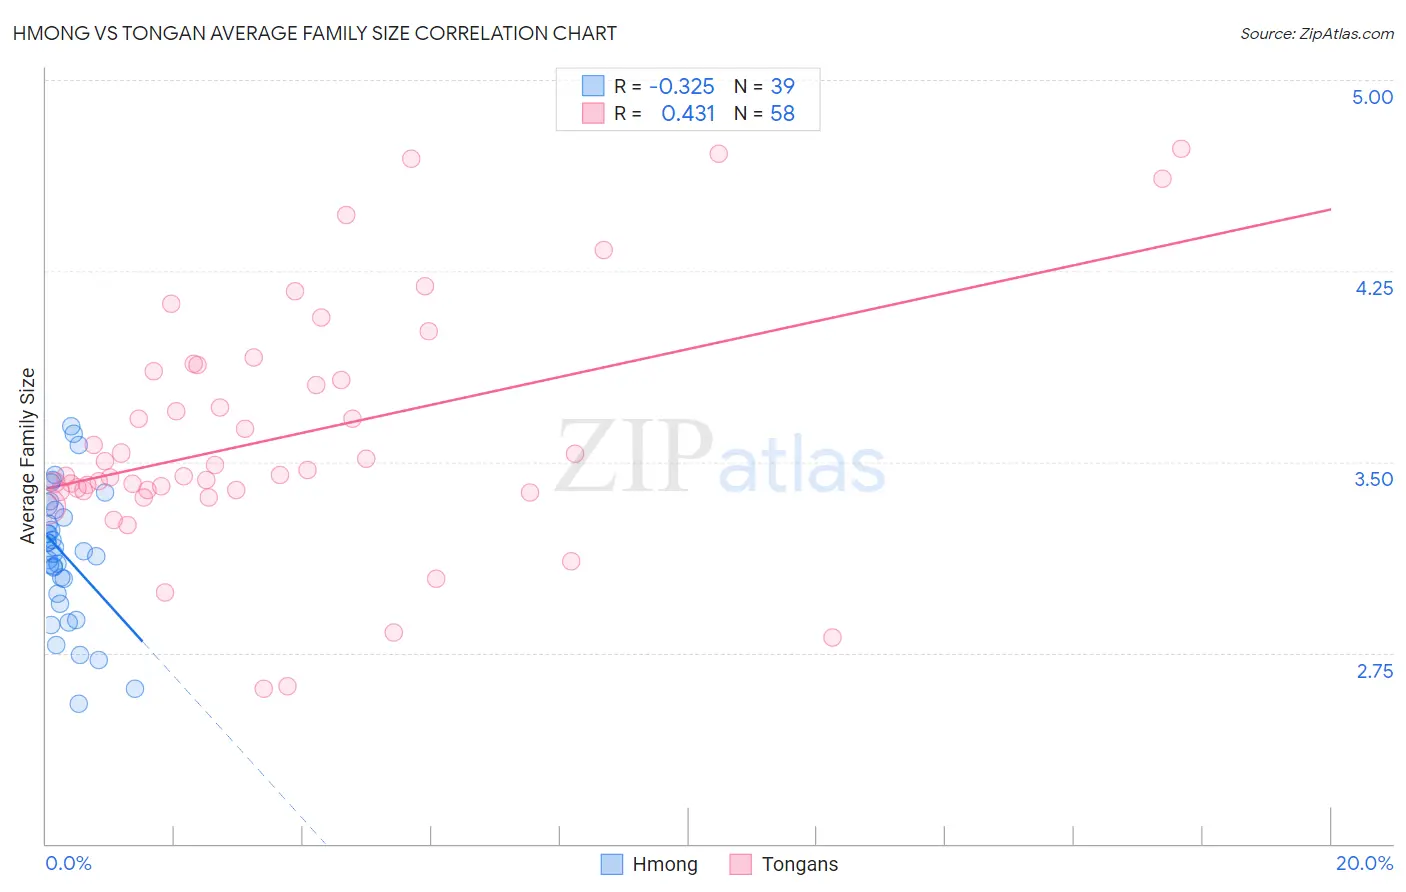
Hmong vs Tongan Average Family Size Correlation Chart

The statistical analysis conducted on geographies consisting of 24,678,157 people shows a mild negative correlation between the proportion of Hmong and average family size in the United States with a correlation coefficient (R) of -0.325 and weighted average of 3.21. Similarly, the statistical analysis conducted on geographies consisting of 102,872,564 people shows a moderate positive correlation between the proportion of Tongans and average family size in the United States with a correlation coefficient (R) of 0.431 and weighted average of 3.49, a difference of 8.8%.
Hmong vs Tongan Average Family Size

Average Family Size Correlation Summary

MeasurementHmongTongan
Minimum2.552.61
Maximum3.644.73
Range1.092.12
Mean3.143.60
Median3.153.46
Interquartile 25% (IQ1)2.983.39
Interquartile 75% (IQ3)3.313.85
Interquartile Range (IQR)0.330.47
Standard Deviation (Sample)0.260.48
Standard Deviation (Population)0.260.47

Similar Demographics by Average Family Size

Demographics Similar to Hmong by Average Family Size

In terms of average family size, the demographic groups most similar to Hmong are Immigrants from the Azores (3.21, a difference of 0.020%), Immigrants from Kenya (3.21, a difference of 0.040%), Immigrants from Morocco (3.21, a difference of 0.060%), Immigrants from India (3.21, a difference of 0.070%), and Immigrants from Nepal (3.21, a difference of 0.080%).
DemographicsRating | RankAverage Family Size
Immigrants | Eastern Africa
30.1
/100
|
#192
Fair
3.22
Immigrants | Israel
29.3
/100
|
#193
Fair
3.22
Immigrants | Sudan
29.1
/100
|
#194
Fair
3.22
Choctaw
28.3
/100
|
#195
Fair
3.21
Senegalese
28.2
/100
|
#196
Fair
3.21
Kenyans
28.0
/100
|
#197
Fair
3.21
Immigrants | Azores
21.7
/100
|
#198
Fair
3.21
Hmong
20.7
/100
|
#199
Fair
3.21
Immigrants | Kenya
19.2
/100
|
#200
Poor
3.21
Immigrants | Morocco
18.5
/100
|
#201
Poor
3.21
Immigrants | India
18.5
/100
|
#202
Poor
3.21
Immigrants | Nepal
18.1
/100
|
#203
Poor
3.21
Immigrants | Poland
16.6
/100
|
#204
Poor
3.20
Paraguayans
16.3
/100
|
#205
Poor
3.20
Immigrants | Cabo Verde
16.0
/100
|
#206
Poor
3.20

Demographics Similar to Tongans by Average Family Size

In terms of average family size, the demographic groups most similar to Tongans are Immigrants from Central America (3.49, a difference of 0.050%), Ute (3.49, a difference of 0.060%), Immigrants from El Salvador (3.49, a difference of 0.15%), Salvadoran (3.48, a difference of 0.40%), and Mexican (3.48, a difference of 0.46%).
DemographicsRating | RankAverage Family Size
Immigrants | Yemen
100.0
/100
|
#8
Exceptional
3.60
Hopi
100.0
/100
|
#9
Exceptional
3.60
Spanish American Indians
100.0
/100
|
#10
Exceptional
3.58
Tohono O'odham
100.0
/100
|
#11
Exceptional
3.53
Immigrants | Mexico
100.0
/100
|
#12
Exceptional
3.52
Sioux
100.0
/100
|
#13
Exceptional
3.52
Immigrants | Central America
100.0
/100
|
#14
Exceptional
3.49
Tongans
100.0
/100
|
#15
Exceptional
3.49
Ute
100.0
/100
|
#16
Exceptional
3.49
Immigrants | El Salvador
100.0
/100
|
#17
Exceptional
3.49
Salvadorans
100.0
/100
|
#18
Exceptional
3.48
Mexicans
100.0
/100
|
#19
Exceptional
3.48
Cheyenne
100.0
/100
|
#20
Exceptional
3.47
Yuman
100.0
/100
|
#21
Exceptional
3.47
Apache
100.0
/100
|
#22
Exceptional
3.46