Hmong vs Central American Average Family Size
COMPARE
Hmong
Central American
Average Family Size
Average Family Size Comparison
Hmong
Central Americans
3.21
AVERAGE FAMILY SIZE
20.7/ 100
METRIC RATING
199th/ 347
METRIC RANK
3.41
AVERAGE FAMILY SIZE
100.0/ 100
METRIC RATING
31st/ 347
METRIC RANK
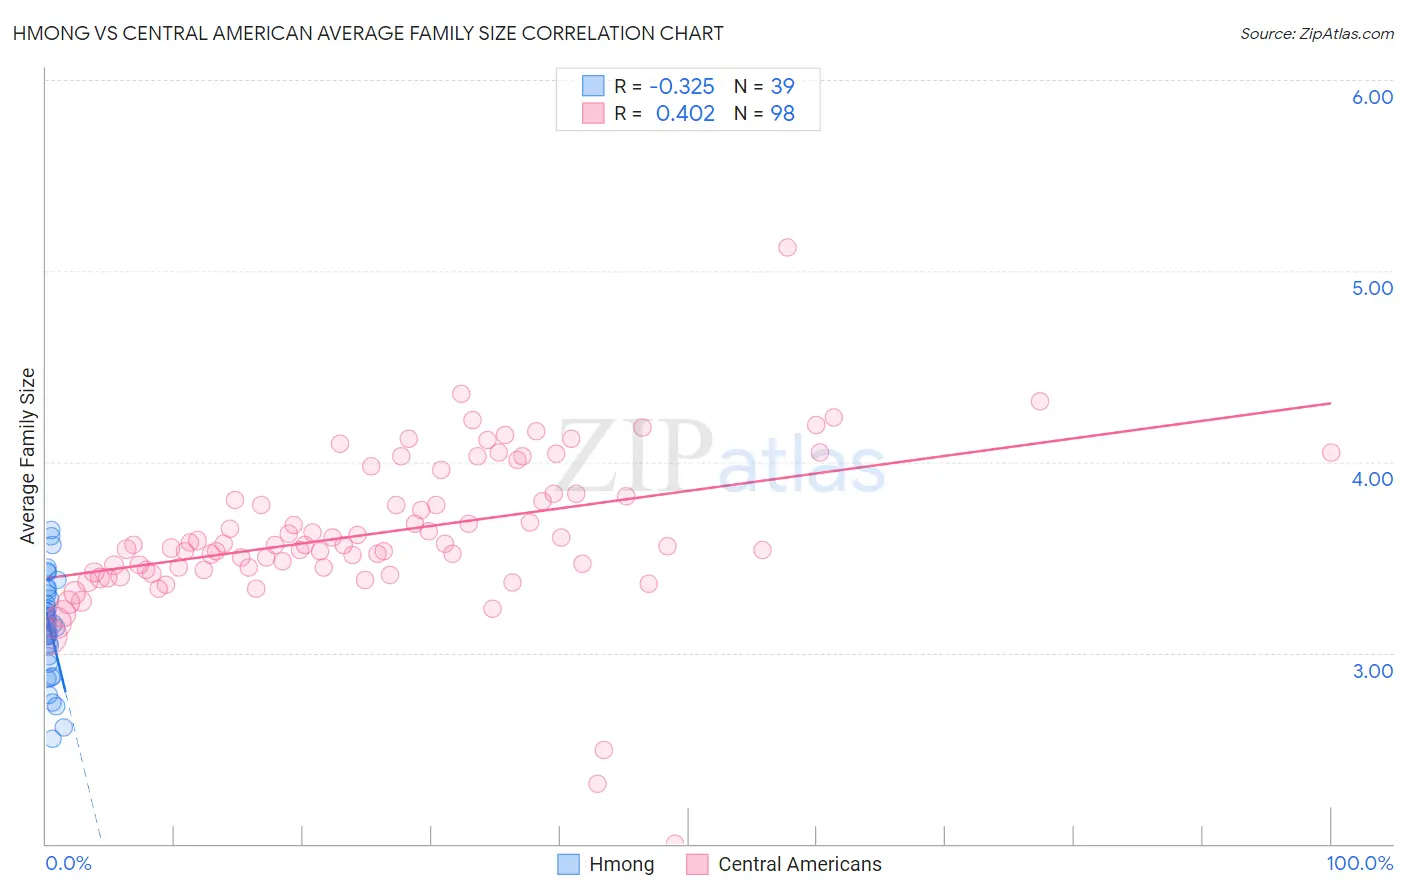
Hmong vs Central American Average Family Size Correlation Chart
The statistical analysis conducted on geographies consisting of 24,678,157 people shows a mild negative correlation between the proportion of Hmong and average family size in the United States with a correlation coefficient (R) of -0.325 and weighted average of 3.21. Similarly, the statistical analysis conducted on geographies consisting of 504,084,527 people shows a moderate positive correlation between the proportion of Central Americans and average family size in the United States with a correlation coefficient (R) of 0.402 and weighted average of 3.41, a difference of 6.4%.
Average Family Size Correlation Summary
| Measurement | Hmong | Central American |
| Minimum | 2.55 | 2.00 |
| Maximum | 3.64 | 5.12 |
| Range | 1.09 | 3.12 |
| Mean | 3.14 | 3.63 |
| Median | 3.15 | 3.56 |
| Interquartile 25% (IQ1) | 2.98 | 3.43 |
| Interquartile 75% (IQ3) | 3.31 | 3.83 |
| Interquartile Range (IQR) | 0.33 | 0.40 |
| Standard Deviation (Sample) | 0.26 | 0.41 |
| Standard Deviation (Population) | 0.26 | 0.40 |
Similar Demographics by Average Family Size
Demographics Similar to Hmong by Average Family Size
In terms of average family size, the demographic groups most similar to Hmong are Immigrants from the Azores (3.21, a difference of 0.020%), Immigrants from Kenya (3.21, a difference of 0.040%), Immigrants from Morocco (3.21, a difference of 0.060%), Immigrants from India (3.21, a difference of 0.070%), and Immigrants from Nepal (3.21, a difference of 0.080%).
| Demographics | Rating | Rank | Average Family Size |
| Immigrants | Eastern Africa | 30.1 /100 | #192 | Fair 3.22 |
| Immigrants | Israel | 29.3 /100 | #193 | Fair 3.22 |
| Immigrants | Sudan | 29.1 /100 | #194 | Fair 3.22 |
| Choctaw | 28.3 /100 | #195 | Fair 3.21 |
| Senegalese | 28.2 /100 | #196 | Fair 3.21 |
| Kenyans | 28.0 /100 | #197 | Fair 3.21 |
| Immigrants | Azores | 21.7 /100 | #198 | Fair 3.21 |
| Hmong | 20.7 /100 | #199 | Fair 3.21 |
| Immigrants | Kenya | 19.2 /100 | #200 | Poor 3.21 |
| Immigrants | Morocco | 18.5 /100 | #201 | Poor 3.21 |
| Immigrants | India | 18.5 /100 | #202 | Poor 3.21 |
| Immigrants | Nepal | 18.1 /100 | #203 | Poor 3.21 |
| Immigrants | Poland | 16.6 /100 | #204 | Poor 3.20 |
| Paraguayans | 16.3 /100 | #205 | Poor 3.20 |
| Immigrants | Cabo Verde | 16.0 /100 | #206 | Poor 3.20 |
Demographics Similar to Central Americans by Average Family Size
In terms of average family size, the demographic groups most similar to Central Americans are Immigrants from Guatemala (3.41, a difference of 0.10%), Hawaiian (3.41, a difference of 0.12%), Hispanic or Latino (3.41, a difference of 0.18%), Samoan (3.42, a difference of 0.20%), and Nepalese (3.42, a difference of 0.23%).
| Demographics | Rating | Rank | Average Family Size |
| Natives/Alaskans | 100.0 /100 | #24 | Exceptional 3.45 |
| Yakama | 100.0 /100 | #25 | Exceptional 3.45 |
| Native Hawaiians | 100.0 /100 | #26 | Exceptional 3.43 |
| Mexican American Indians | 100.0 /100 | #27 | Exceptional 3.43 |
| Immigrants | Latin America | 100.0 /100 | #28 | Exceptional 3.42 |
| Nepalese | 100.0 /100 | #29 | Exceptional 3.42 |
| Samoans | 100.0 /100 | #30 | Exceptional 3.42 |
| Central Americans | 100.0 /100 | #31 | Exceptional 3.41 |
| Immigrants | Guatemala | 100.0 /100 | #32 | Exceptional 3.41 |
| Hawaiians | 100.0 /100 | #33 | Exceptional 3.41 |
| Hispanics or Latinos | 100.0 /100 | #34 | Exceptional 3.41 |
| Guatemalans | 100.0 /100 | #35 | Exceptional 3.40 |
| Immigrants | Guyana | 100.0 /100 | #36 | Exceptional 3.40 |
| Guyanese | 100.0 /100 | #37 | Exceptional 3.40 |
| Immigrants | Belize | 100.0 /100 | #38 | Exceptional 3.39 |