Hmong vs Spanish American Family Households
COMPARE
Hmong
Spanish American
Family Households
Family Households Comparison
Hmong
Spanish Americans
64.9%
FAMILY HOUSEHOLDS
93.4/ 100
METRIC RATING
122nd/ 347
METRIC RANK
64.1%
FAMILY HOUSEHOLDS
30.1/ 100
METRIC RATING
186th/ 347
METRIC RANK
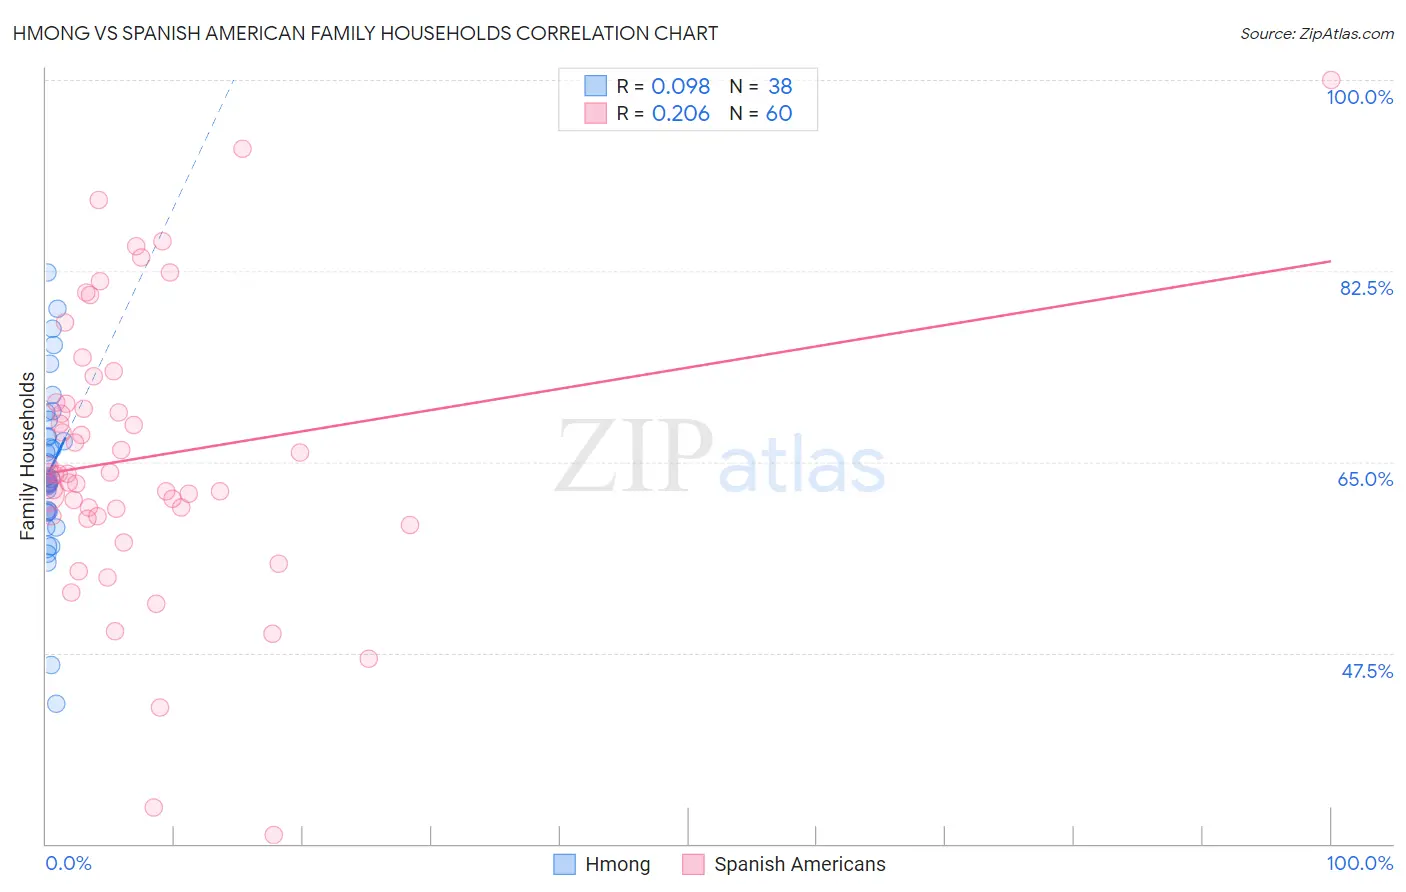
Hmong vs Spanish American Family Households Correlation Chart
The statistical analysis conducted on geographies consisting of 24,604,422 people shows a slight positive correlation between the proportion of Hmong and percentage of family households in the United States with a correlation coefficient (R) of 0.098 and weighted average of 64.9%. Similarly, the statistical analysis conducted on geographies consisting of 103,168,621 people shows a weak positive correlation between the proportion of Spanish Americans and percentage of family households in the United States with a correlation coefficient (R) of 0.206 and weighted average of 64.1%, a difference of 1.2%.
Family Households Correlation Summary
| Measurement | Hmong | Spanish American |
| Minimum | 42.8% | 30.8% |
| Maximum | 82.3% | 100.0% |
| Range | 39.5% | 69.2% |
| Mean | 64.2% | 65.4% |
| Median | 63.3% | 63.9% |
| Interquartile 25% (IQ1) | 60.4% | 60.0% |
| Interquartile 75% (IQ3) | 67.3% | 70.4% |
| Interquartile Range (IQR) | 6.9% | 10.4% |
| Standard Deviation (Sample) | 7.8% | 12.9% |
| Standard Deviation (Population) | 7.7% | 12.8% |
Similar Demographics by Family Households
Demographics Similar to Hmong by Family Households
In terms of family households, the demographic groups most similar to Hmong are Choctaw (64.9%, a difference of 0.0%), Immigrants from Argentina (64.9%, a difference of 0.030%), Immigrants from Belize (64.9%, a difference of 0.030%), Hungarian (64.9%, a difference of 0.040%), and Immigrants from Oceania (64.9%, a difference of 0.050%).
| Demographics | Rating | Rank | Family Households |
| Ecuadorians | 95.4 /100 | #115 | Exceptional 65.0% |
| Immigrants | Iraq | 95.4 /100 | #116 | Exceptional 65.0% |
| Cherokee | 95.3 /100 | #117 | Exceptional 65.0% |
| Dutch | 95.1 /100 | #118 | Exceptional 64.9% |
| Immigrants | Eastern Asia | 94.4 /100 | #119 | Exceptional 64.9% |
| Immigrants | Oceania | 94.2 /100 | #120 | Exceptional 64.9% |
| Hungarians | 94.0 /100 | #121 | Exceptional 64.9% |
| Hmong | 93.4 /100 | #122 | Exceptional 64.9% |
| Choctaw | 93.4 /100 | #123 | Exceptional 64.9% |
| Immigrants | Argentina | 92.8 /100 | #124 | Exceptional 64.9% |
| Immigrants | Belize | 92.7 /100 | #125 | Exceptional 64.9% |
| Panamanians | 92.4 /100 | #126 | Exceptional 64.8% |
| Immigrants | Panama | 92.0 /100 | #127 | Exceptional 64.8% |
| Italians | 91.9 /100 | #128 | Exceptional 64.8% |
| Immigrants | Ecuador | 91.4 /100 | #129 | Exceptional 64.8% |
Demographics Similar to Spanish Americans by Family Households
In terms of family households, the demographic groups most similar to Spanish Americans are Immigrants from Iran (64.1%, a difference of 0.010%), Northern European (64.1%, a difference of 0.030%), Puerto Rican (64.2%, a difference of 0.050%), Creek (64.2%, a difference of 0.060%), and Paraguayan (64.1%, a difference of 0.060%).
| Demographics | Rating | Rank | Family Households |
| Immigrants | Ukraine | 38.2 /100 | #179 | Fair 64.2% |
| Immigrants | Honduras | 35.0 /100 | #180 | Fair 64.2% |
| Immigrants | Trinidad and Tobago | 34.9 /100 | #181 | Fair 64.2% |
| Ukrainians | 34.6 /100 | #182 | Fair 64.2% |
| Creek | 34.1 /100 | #183 | Fair 64.2% |
| Puerto Ricans | 33.4 /100 | #184 | Fair 64.2% |
| Immigrants | Iran | 30.4 /100 | #185 | Fair 64.1% |
| Spanish Americans | 30.1 /100 | #186 | Fair 64.1% |
| Northern Europeans | 28.2 /100 | #187 | Fair 64.1% |
| Paraguayans | 26.7 /100 | #188 | Fair 64.1% |
| Immigrants | Western Asia | 25.3 /100 | #189 | Fair 64.1% |
| Zimbabweans | 24.7 /100 | #190 | Fair 64.1% |
| Arabs | 24.5 /100 | #191 | Fair 64.1% |
| Lithuanians | 23.8 /100 | #192 | Fair 64.0% |
| French | 23.7 /100 | #193 | Fair 64.0% |