Immigrants from Cameroon vs Spanish American Family Households
COMPARE
Immigrants from Cameroon
Spanish American
Family Households
Family Households Comparison
Immigrants from Cameroon
Spanish Americans
64.7%
FAMILY HOUSEHOLDS
84.8/ 100
METRIC RATING
141st/ 347
METRIC RANK
64.1%
FAMILY HOUSEHOLDS
30.1/ 100
METRIC RATING
186th/ 347
METRIC RANK
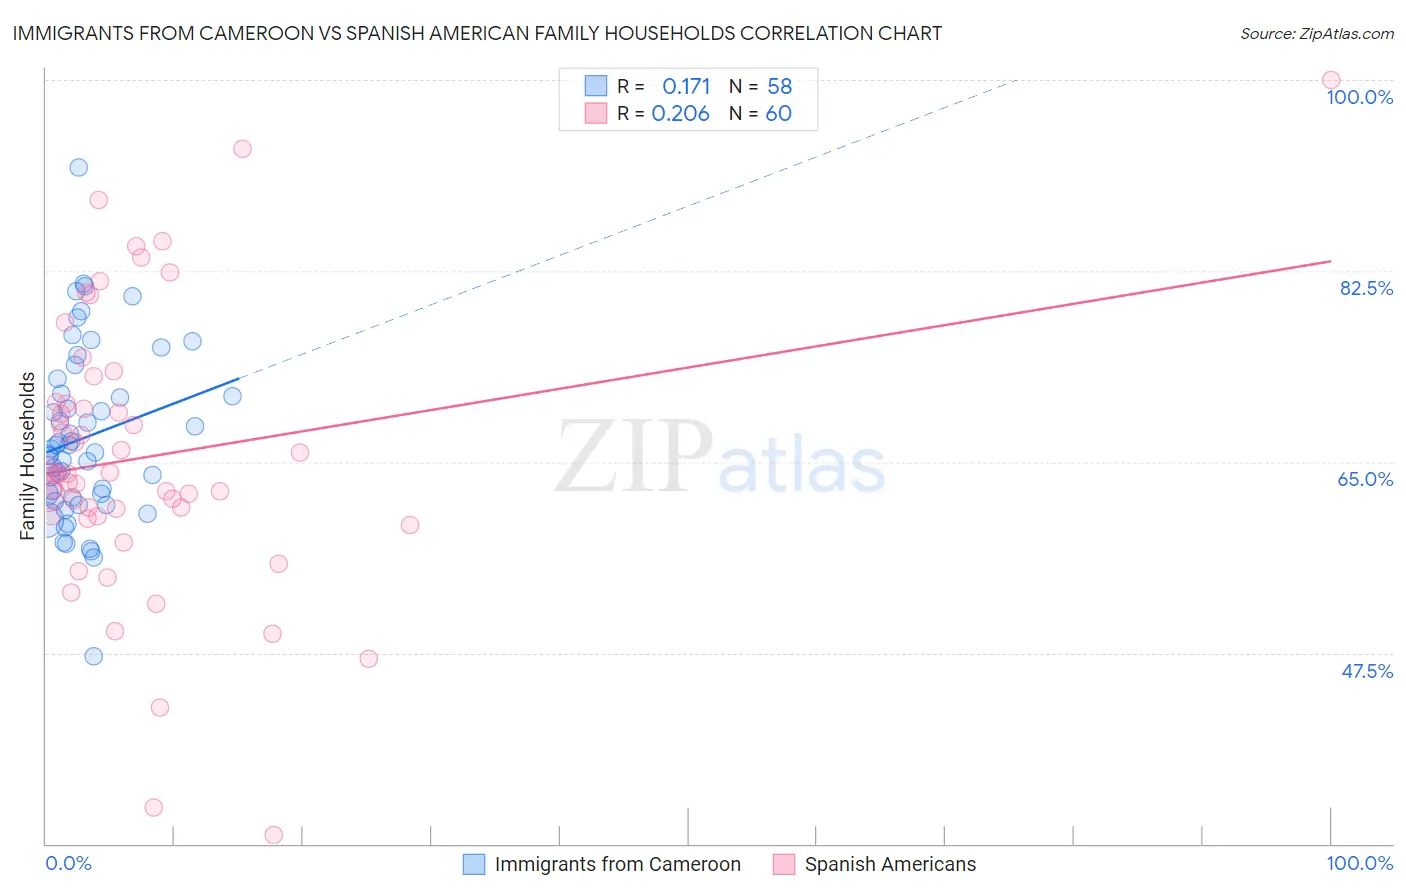
Immigrants from Cameroon vs Spanish American Family Households Correlation Chart
The statistical analysis conducted on geographies consisting of 130,734,594 people shows a poor positive correlation between the proportion of Immigrants from Cameroon and percentage of family households in the United States with a correlation coefficient (R) of 0.171 and weighted average of 64.7%. Similarly, the statistical analysis conducted on geographies consisting of 103,168,621 people shows a weak positive correlation between the proportion of Spanish Americans and percentage of family households in the United States with a correlation coefficient (R) of 0.206 and weighted average of 64.1%, a difference of 0.86%.
Family Households Correlation Summary
| Measurement | Immigrants from Cameroon | Spanish American |
| Minimum | 47.1% | 30.8% |
| Maximum | 92.0% | 100.0% |
| Range | 44.8% | 69.2% |
| Mean | 67.2% | 65.4% |
| Median | 66.0% | 63.9% |
| Interquartile 25% (IQ1) | 61.7% | 60.0% |
| Interquartile 75% (IQ3) | 71.3% | 70.4% |
| Interquartile Range (IQR) | 9.5% | 10.4% |
| Standard Deviation (Sample) | 8.0% | 12.9% |
| Standard Deviation (Population) | 7.9% | 12.8% |
Similar Demographics by Family Households
Demographics Similar to Immigrants from Cameroon by Family Households
In terms of family households, the demographic groups most similar to Immigrants from Cameroon are Immigrants from North Macedonia (64.7%, a difference of 0.0%), Immigrants from Jamaica (64.7%, a difference of 0.010%), Basque (64.7%, a difference of 0.020%), Pakistani (64.7%, a difference of 0.020%), and Immigrants from Scotland (64.7%, a difference of 0.040%).
| Demographics | Rating | Rank | Family Households |
| Greeks | 88.1 /100 | #134 | Excellent 64.7% |
| Maltese | 87.4 /100 | #135 | Excellent 64.7% |
| Immigrants | China | 86.6 /100 | #136 | Excellent 64.7% |
| Immigrants | Scotland | 86.4 /100 | #137 | Excellent 64.7% |
| Basques | 85.5 /100 | #138 | Excellent 64.7% |
| Immigrants | Jamaica | 85.3 /100 | #139 | Excellent 64.7% |
| Immigrants | North Macedonia | 84.9 /100 | #140 | Excellent 64.7% |
| Immigrants | Cameroon | 84.8 /100 | #141 | Excellent 64.7% |
| Pakistanis | 84.0 /100 | #142 | Excellent 64.7% |
| Czechoslovakians | 82.1 /100 | #143 | Excellent 64.6% |
| South American Indians | 81.9 /100 | #144 | Excellent 64.6% |
| Welsh | 80.1 /100 | #145 | Excellent 64.6% |
| Immigrants | Romania | 77.0 /100 | #146 | Good 64.6% |
| Immigrants | Chile | 76.5 /100 | #147 | Good 64.6% |
| Delaware | 76.3 /100 | #148 | Good 64.6% |
Demographics Similar to Spanish Americans by Family Households
In terms of family households, the demographic groups most similar to Spanish Americans are Immigrants from Iran (64.1%, a difference of 0.010%), Northern European (64.1%, a difference of 0.030%), Puerto Rican (64.2%, a difference of 0.050%), Creek (64.2%, a difference of 0.060%), and Paraguayan (64.1%, a difference of 0.060%).
| Demographics | Rating | Rank | Family Households |
| Immigrants | Ukraine | 38.2 /100 | #179 | Fair 64.2% |
| Immigrants | Honduras | 35.0 /100 | #180 | Fair 64.2% |
| Immigrants | Trinidad and Tobago | 34.9 /100 | #181 | Fair 64.2% |
| Ukrainians | 34.6 /100 | #182 | Fair 64.2% |
| Creek | 34.1 /100 | #183 | Fair 64.2% |
| Puerto Ricans | 33.4 /100 | #184 | Fair 64.2% |
| Immigrants | Iran | 30.4 /100 | #185 | Fair 64.1% |
| Spanish Americans | 30.1 /100 | #186 | Fair 64.1% |
| Northern Europeans | 28.2 /100 | #187 | Fair 64.1% |
| Paraguayans | 26.7 /100 | #188 | Fair 64.1% |
| Immigrants | Western Asia | 25.3 /100 | #189 | Fair 64.1% |
| Zimbabweans | 24.7 /100 | #190 | Fair 64.1% |
| Arabs | 24.5 /100 | #191 | Fair 64.1% |
| Lithuanians | 23.8 /100 | #192 | Fair 64.0% |
| French | 23.7 /100 | #193 | Fair 64.0% |