Guamanian/Chamorro vs Immigrants from Lithuania Family Households

COMPARE

Guamanian/Chamorro
Race
Ancestry
AfghanAfricanAlaska NativeAlaskan AthabascanAlbanianAleutAlsatianAmericanApacheArabArapahoArgentineanArmenianAssyrian/Chaldean/SyriacAustralianAustrianBahamianBangladeshiBarbadianBasqueBelgianBelizeanBermudanBhutaneseBlackfeetBolivianBrazilianBritishBritish West IndianBulgarianBurmeseCajunCambodianCanadianCape VerdeanCarpatho RusynCelticCentral AmericanCentral American IndianCherokeeCheyenneChickasawChileanChineseChippewaChoctawColombianColvilleComancheCosta RicanCreeCreekCroatianCrowCubanCypriotCzechCzechoslovakianDanishDelawareDominicanDutchDutch West IndianEastern EuropeanEcuadorianEgyptianEnglishEstonianEthiopianEuropeanFijianFilipinoFinnishFrenchFrench American IndianFrench CanadianGermanGerman RussianGhanaianGreekGuamanian/ChamorroGuatemalanGuyaneseHaitianHmongHonduranHopiHoumaHungarianIcelanderIndian (Asian)IndonesianInupiatIranianIraqiIrishIroquoisIsraeliItalianJamaicanJapaneseJordanianKenyanKiowaKoreanLaotianLatvianLebaneseLiberianLithuanianLumbeeLuxembourgerMacedonianMalaysianMalteseMarshalleseMenomineeMexicanMexican American IndianMongolianMoroccanNative HawaiianNavajoNepaleseNew ZealanderNicaraguanNigerianNorthern EuropeanNorwegianOkinawanOsageOttawaPaiutePakistaniPalestinianPanamanianParaguayanPennsylvania GermanPeruvianPimaPolishPortuguesePotawatomiPuebloPuerto RicanPuget Sound SalishRomanianRussianSalvadoranSamoanScandinavianScotch-IrishScottishSeminoleSenegaleseSerbianShoshoneSierra LeoneanSiouxSlavicSlovakSloveneSomaliSouth AfricanSouth AmericanSouth American IndianSoviet UnionSpaniardSpanishSpanish AmericanSpanish American IndianSri LankanSubsaharan AfricanSudaneseSwedishSwissSyrianTaiwaneseThaiTlingit-HaidaTohono O'OdhamTonganTrinidadian and TobagonianTsimshianTurkishU.S. Virgin IslanderUgandanUkrainianUruguayanUteVenezuelanVietnameseWelshWest IndianYakamaYaquiYugoslavianYumanYup'ikZimbabwean
Immigration
NonimmigrantsImmigrantsAfghanistanAfricaAlbaniaArgentinaArmeniaAsiaAustraliaAustriaBahamasBangladeshBarbadosBelarusBelgiumBelizeBoliviaBosnia and HerzegovinaBrazilBulgariaBurma/MyanmarCabo VerdeCambodiaCameroonCanadaCaribbeanCentral AmericaChileChinaColombiaCongoCosta RicaCroatiaCubaCzechoslovakiaDenmarkDominicaDominican RepublicEastern AfricaEastern AsiaEastern EuropeEcuadorEgyptEl SalvadorEnglandEritreaEthiopiaEuropeFijiFranceGermanyGhanaGreeceGrenadaGuatemalaGuyanaHaitiHondurasHong KongHungaryIndiaIndonesiaIranIraqIrelandIsraelItalyJamaicaJapanJordanKazakhstanKenyaKoreaKuwaitLaosLatin AmericaLatviaLebanonLiberiaMalaysiaMexicoMicronesiaMiddle AfricaMoldovaMoroccoNepalNetherlandsNicaraguaNigeriaNorth AmericaNorth MacedoniaNorthern AfricaNorthern EuropeNorwayOceaniaPakistanPanamaPeruPhilippinesPolandPortugalRomaniaRussiaSaudi ArabiaScotlandSenegalSerbiaSierra LeoneSingaporeSomaliaSouth AfricaSouth AmericaSouth Central AsiaSouth Eastern AsiaSouthern EuropeSpainSri LankaSt. Vincent and the GrenadinesSudanSwedenSwitzerlandSyriaTaiwanThailandTrinidad and TobagoTurkeyUgandaUkraineUruguayUzbekistanVenezuelaVietnamWest IndiesWestern AfricaWestern AsiaWestern EuropeYemenZaireZimbabweAzores
Immigrants from Lithuania
Race
Ancestry
AfghanAfricanAlaska NativeAlaskan AthabascanAlbanianAleutAlsatianAmericanApacheArabArapahoArgentineanArmenianAssyrian/Chaldean/SyriacAustralianAustrianBahamianBangladeshiBarbadianBasqueBelgianBelizeanBermudanBhutaneseBlackfeetBolivianBrazilianBritishBritish West IndianBulgarianBurmeseCajunCambodianCanadianCape VerdeanCarpatho RusynCelticCentral AmericanCentral American IndianCherokeeCheyenneChickasawChileanChineseChippewaChoctawColombianColvilleComancheCosta RicanCreeCreekCroatianCrowCubanCypriotCzechCzechoslovakianDanishDelawareDominicanDutchDutch West IndianEastern EuropeanEcuadorianEgyptianEnglishEstonianEthiopianEuropeanFijianFilipinoFinnishFrenchFrench American IndianFrench CanadianGermanGerman RussianGhanaianGreekGuatemalanGuyaneseHaitianHmongHonduranHopiHoumaHungarianIcelanderIndian (Asian)IndonesianInupiatIranianIraqiIrishIroquoisIsraeliItalianJamaicanJapaneseJordanianKenyanKiowaKoreanLaotianLatvianLebaneseLiberianLithuanianLumbeeLuxembourgerMacedonianMalaysianMalteseMarshalleseMenomineeMexicanMexican American IndianMongolianMoroccanNative HawaiianNavajoNepaleseNew ZealanderNicaraguanNigerianNorthern EuropeanNorwegianOkinawanOsageOttawaPaiutePakistaniPalestinianPanamanianParaguayanPennsylvania GermanPeruvianPimaPolishPortuguesePotawatomiPuebloPuerto RicanPuget Sound SalishRomanianRussianSalvadoranSamoanScandinavianScotch-IrishScottishSeminoleSenegaleseSerbianShoshoneSierra LeoneanSiouxSlavicSlovakSloveneSomaliSouth AfricanSouth AmericanSouth American IndianSoviet UnionSpaniardSpanishSpanish AmericanSpanish American IndianSri LankanSubsaharan AfricanSudaneseSwedishSwissSyrianTaiwaneseThaiTlingit-HaidaTohono O'OdhamTonganTrinidadian and TobagonianTsimshianTurkishU.S. Virgin IslanderUgandanUkrainianUruguayanUteVenezuelanVietnameseWelshWest IndianYakamaYaquiYugoslavianYumanYup'ikZimbabwean
Immigration
NonimmigrantsImmigrantsAfghanistanAfricaAlbaniaArgentinaArmeniaAsiaAustraliaAustriaBahamasBangladeshBarbadosBelarusBelgiumBelizeBoliviaBosnia and HerzegovinaBrazilBulgariaBurma/MyanmarCabo VerdeCambodiaCameroonCanadaCaribbeanCentral AmericaChileChinaColombiaCongoCosta RicaCroatiaCubaCzechoslovakiaDenmarkDominicaDominican RepublicEastern AfricaEastern AsiaEastern EuropeEcuadorEgyptEl SalvadorEnglandEritreaEthiopiaEuropeFijiFranceGermanyGhanaGreeceGrenadaGuatemalaGuyanaHaitiHondurasHong KongHungaryIndiaIndonesiaIranIraqIrelandIsraelItalyJamaicaJapanJordanKazakhstanKenyaKoreaKuwaitLaosLatin AmericaLatviaLebanonLiberiaLithuaniaMalaysiaMexicoMicronesiaMiddle AfricaMoldovaMoroccoNepalNetherlandsNicaraguaNigeriaNorth AmericaNorth MacedoniaNorthern AfricaNorthern EuropeNorwayOceaniaPakistanPanamaPeruPhilippinesPolandPortugalRomaniaRussiaSaudi ArabiaScotlandSenegalSerbiaSierra LeoneSingaporeSomaliaSouth AfricaSouth AmericaSouth Central AsiaSouth Eastern AsiaSouthern EuropeSpainSri LankaSt. Vincent and the GrenadinesSudanSwedenSwitzerlandSyriaTaiwanThailandTrinidad and TobagoTurkeyUgandaUkraineUruguayUzbekistanVenezuelaVietnamWest IndiesWestern AfricaWestern AsiaWestern EuropeYemenZaireZimbabweAzores
Family Households
Income
Poverty
Unemployment
Labor Participation
Family Structure
Vehicle Availability
Education Level
Disability

Family Households Comparison

Guamanians/Chamorros

Immigrants from Lithuania

Exceptional
Poor
66.6%
FAMILY HOUSEHOLDS
100.0/ 100
METRIC RATING
40th/ 347
METRIC RANK
63.9%
FAMILY HOUSEHOLDS
12.1/ 100
METRIC RATING
206th/ 347
METRIC RANK

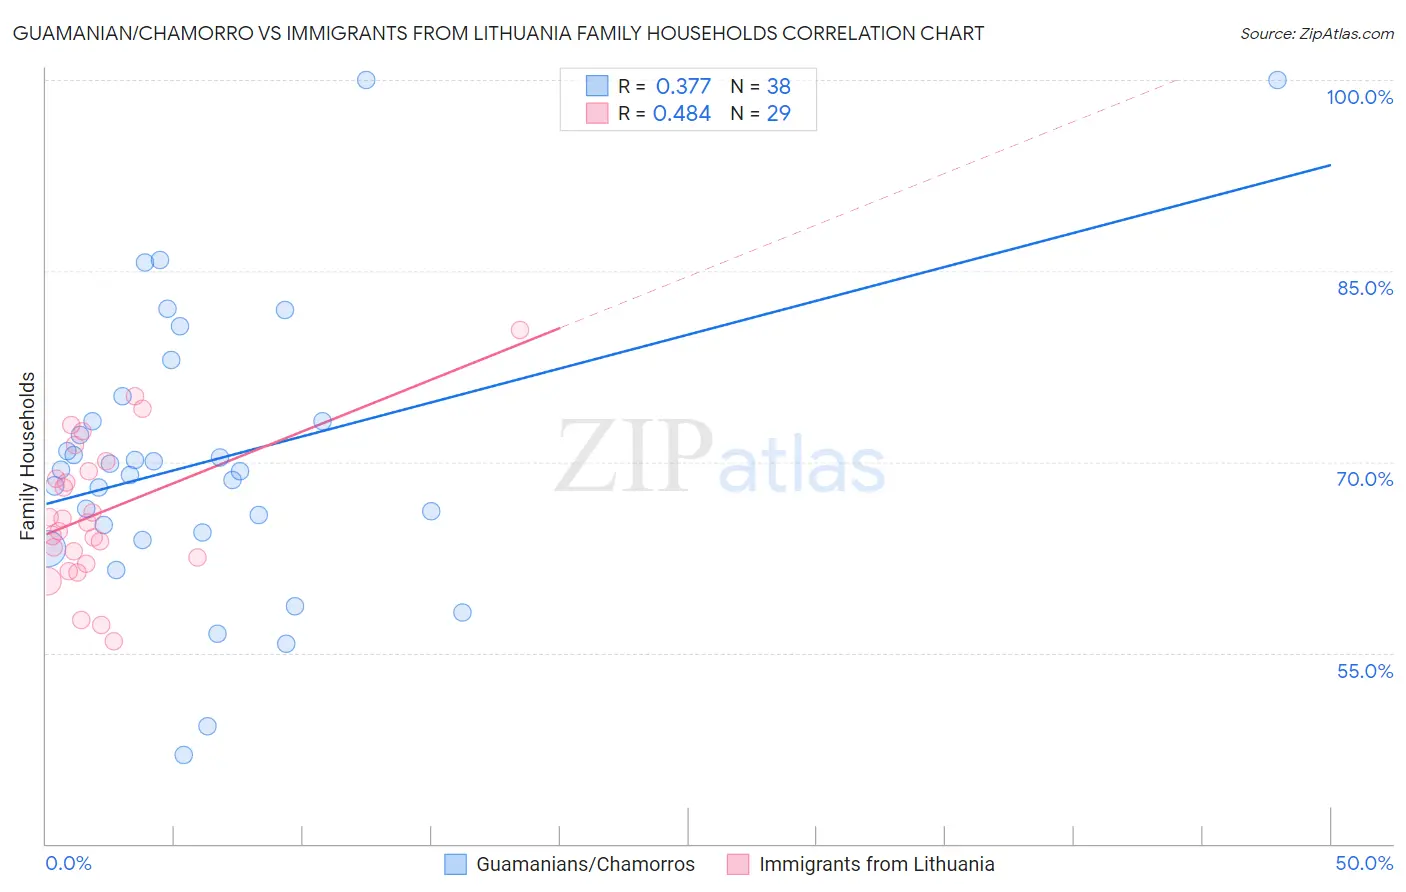
Guamanian/Chamorro vs Immigrants from Lithuania Family Households Correlation Chart

The statistical analysis conducted on geographies consisting of 221,865,945 people shows a mild positive correlation between the proportion of Guamanians/Chamorros and percentage of family households in the United States with a correlation coefficient (R) of 0.377 and weighted average of 66.6%. Similarly, the statistical analysis conducted on geographies consisting of 117,713,482 people shows a moderate positive correlation between the proportion of Immigrants from Lithuania and percentage of family households in the United States with a correlation coefficient (R) of 0.484 and weighted average of 63.9%, a difference of 4.3%.
Guamanian/Chamorro vs Immigrants from Lithuania Family Households

Family Households Correlation Summary

MeasurementGuamanian/ChamorroImmigrants from Lithuania
Minimum47.0%55.9%
Maximum100.0%80.4%
Range53.0%24.4%
Mean70.1%66.0%
Median69.3%65.2%
Interquartile 25% (IQ1)64.4%62.3%
Interquartile 75% (IQ3)73.2%69.6%
Interquartile Range (IQR)8.8%7.4%
Standard Deviation (Sample)11.3%5.7%
Standard Deviation (Population)11.1%5.6%

Similar Demographics by Family Households

Demographics Similar to Guamanians/Chamorros by Family Households

In terms of family households, the demographic groups most similar to Guamanians/Chamorros are Immigrants from Bolivia (66.6%, a difference of 0.030%), Menominee (66.5%, a difference of 0.090%), Apache (66.5%, a difference of 0.10%), Asian (66.5%, a difference of 0.15%), and Venezuelan (66.5%, a difference of 0.17%).
DemographicsRating | RankFamily Households
Salvadorans
100.0
/100
|
#33
Exceptional
67.2%
Thais
100.0
/100
|
#34
Exceptional
67.2%
Tohono O'odham
100.0
/100
|
#35
Exceptional
67.1%
Peruvians
100.0
/100
|
#36
Exceptional
67.1%
Tsimshian
100.0
/100
|
#37
Exceptional
67.1%
Mexican American Indians
100.0
/100
|
#38
Exceptional
67.0%
Immigrants | El Salvador
100.0
/100
|
#39
Exceptional
67.0%
Guamanians/Chamorros
100.0
/100
|
#40
Exceptional
66.6%
Immigrants | Bolivia
100.0
/100
|
#41
Exceptional
66.6%
Menominee
100.0
/100
|
#42
Exceptional
66.5%
Apache
100.0
/100
|
#43
Exceptional
66.5%
Asians
100.0
/100
|
#44
Exceptional
66.5%
Venezuelans
100.0
/100
|
#45
Exceptional
66.5%
Arapaho
100.0
/100
|
#46
Exceptional
66.5%
Bolivians
100.0
/100
|
#47
Exceptional
66.5%

Demographics Similar to Immigrants from Lithuania by Family Households

In terms of family households, the demographic groups most similar to Immigrants from Lithuania are Brazilian (63.9%, a difference of 0.010%), Immigrants from Uruguay (63.9%, a difference of 0.020%), Nigerian (63.9%, a difference of 0.020%), Immigrants from Bangladesh (63.9%, a difference of 0.020%), and Norwegian (63.9%, a difference of 0.030%).
DemographicsRating | RankFamily Households
Slavs
18.6
/100
|
#199
Poor
64.0%
Immigrants | Malaysia
17.9
/100
|
#200
Poor
64.0%
Immigrants | Eastern Europe
17.2
/100
|
#201
Poor
64.0%
Iranians
13.5
/100
|
#202
Poor
63.9%
Norwegians
13.2
/100
|
#203
Poor
63.9%
Immigrants | Uruguay
12.8
/100
|
#204
Poor
63.9%
Brazilians
12.4
/100
|
#205
Poor
63.9%
Immigrants | Lithuania
12.1
/100
|
#206
Poor
63.9%
Nigerians
11.5
/100
|
#207
Poor
63.9%
Immigrants | Bangladesh
11.4
/100
|
#208
Poor
63.9%
Sierra Leoneans
11.2
/100
|
#209
Poor
63.9%
Immigrants | Thailand
9.6
/100
|
#210
Tragic
63.8%
Shoshone
9.4
/100
|
#211
Tragic
63.8%
Immigrants | Netherlands
9.4
/100
|
#212
Tragic
63.8%
Immigrants | Northern Europe
8.8
/100
|
#213
Tragic
63.8%