Fijian vs Immigrants from Ukraine Single Mother Households
COMPARE
Fijian
Immigrants from Ukraine
Single Mother Households
Single Mother Households Comparison
Fijians
Immigrants from Ukraine
7.2%
SINGLE MOTHER HOUSEHOLDS
0.6/ 100
METRIC RATING
242nd/ 347
METRIC RANK
5.8%
SINGLE MOTHER HOUSEHOLDS
95.9/ 100
METRIC RATING
106th/ 347
METRIC RANK
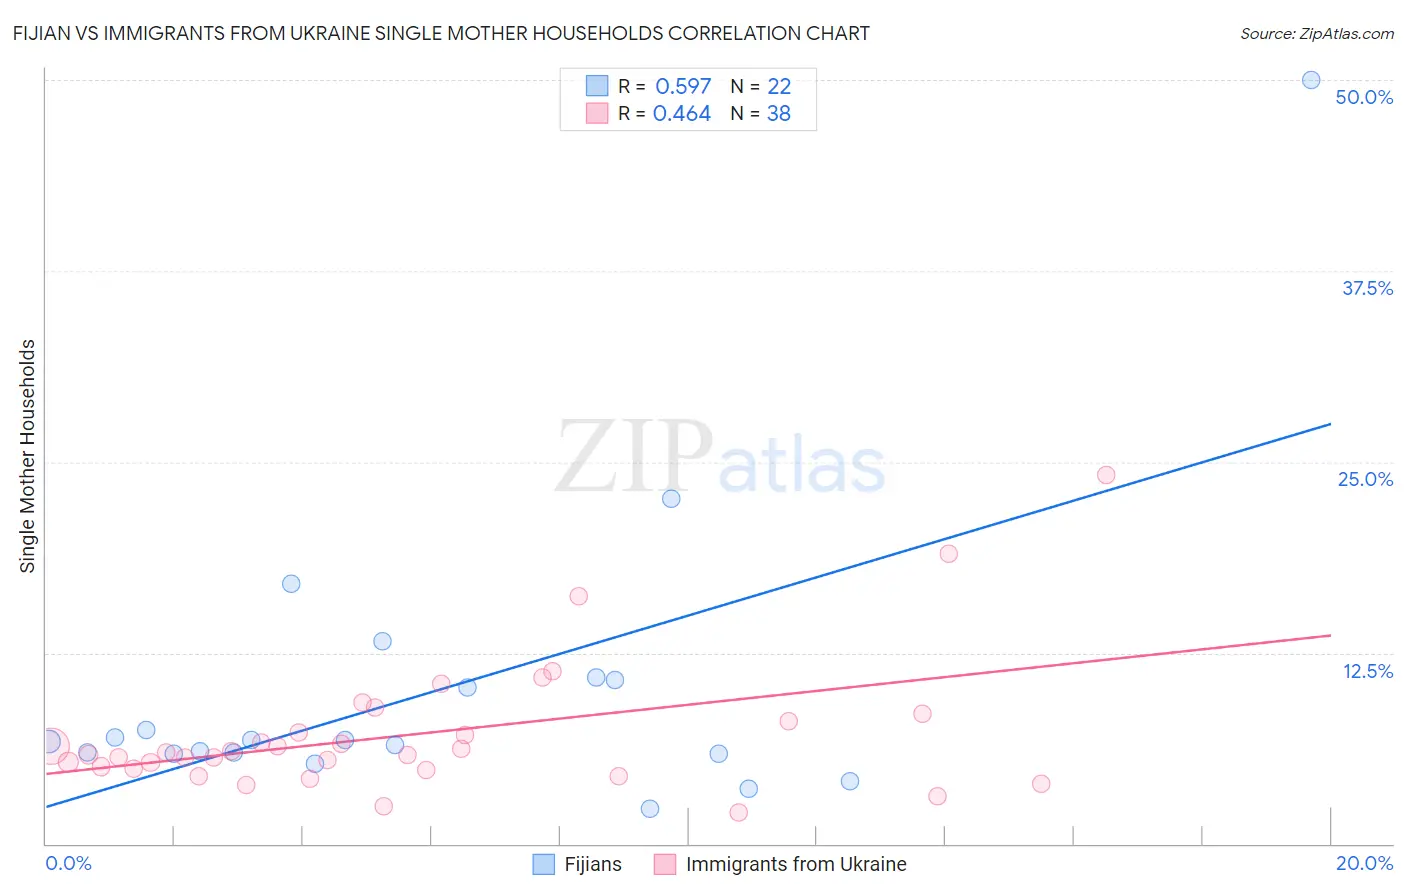
Fijian vs Immigrants from Ukraine Single Mother Households Correlation Chart
The statistical analysis conducted on geographies consisting of 55,926,537 people shows a substantial positive correlation between the proportion of Fijians and percentage of single mother households in the United States with a correlation coefficient (R) of 0.597 and weighted average of 7.2%. Similarly, the statistical analysis conducted on geographies consisting of 289,094,970 people shows a moderate positive correlation between the proportion of Immigrants from Ukraine and percentage of single mother households in the United States with a correlation coefficient (R) of 0.464 and weighted average of 5.8%, a difference of 24.8%.
Single Mother Households Correlation Summary
| Measurement | Fijian | Immigrants from Ukraine |
| Minimum | 2.3% | 2.1% |
| Maximum | 50.0% | 24.1% |
| Range | 47.7% | 22.1% |
| Mean | 10.0% | 7.2% |
| Median | 6.7% | 5.9% |
| Interquartile 25% (IQ1) | 5.9% | 4.9% |
| Interquartile 75% (IQ3) | 10.7% | 8.0% |
| Interquartile Range (IQR) | 4.8% | 3.1% |
| Standard Deviation (Sample) | 10.0% | 4.4% |
| Standard Deviation (Population) | 9.8% | 4.3% |
Similar Demographics by Single Mother Households
Demographics Similar to Fijians by Single Mother Households
In terms of single mother households, the demographic groups most similar to Fijians are Ecuadorian (7.2%, a difference of 0.050%), Immigrants from Portugal (7.2%, a difference of 0.080%), Cuban (7.2%, a difference of 0.11%), Immigrants from Panama (7.2%, a difference of 0.43%), and Immigrants from Cambodia (7.2%, a difference of 0.46%).
| Demographics | Rating | Rank | Single Mother Households |
| Immigrants | Burma/Myanmar | 1.4 /100 | #235 | Tragic 7.0% |
| Ute | 1.0 /100 | #236 | Tragic 7.1% |
| Arapaho | 1.0 /100 | #237 | Tragic 7.1% |
| Panamanians | 0.9 /100 | #238 | Tragic 7.1% |
| Kiowa | 0.8 /100 | #239 | Tragic 7.1% |
| Immigrants | Panama | 0.7 /100 | #240 | Tragic 7.2% |
| Immigrants | Portugal | 0.6 /100 | #241 | Tragic 7.2% |
| Fijians | 0.6 /100 | #242 | Tragic 7.2% |
| Ecuadorians | 0.6 /100 | #243 | Tragic 7.2% |
| Cubans | 0.6 /100 | #244 | Tragic 7.2% |
| Immigrants | Cambodia | 0.5 /100 | #245 | Tragic 7.2% |
| Nicaraguans | 0.5 /100 | #246 | Tragic 7.2% |
| Dutch West Indians | 0.4 /100 | #247 | Tragic 7.3% |
| Spanish American Indians | 0.4 /100 | #248 | Tragic 7.3% |
| Bermudans | 0.4 /100 | #249 | Tragic 7.3% |
Demographics Similar to Immigrants from Ukraine by Single Mother Households
In terms of single mother households, the demographic groups most similar to Immigrants from Ukraine are Taiwanese (5.8%, a difference of 0.10%), Paraguayan (5.8%, a difference of 0.11%), Immigrants from Italy (5.8%, a difference of 0.12%), Scottish (5.8%, a difference of 0.18%), and Northern European (5.8%, a difference of 0.18%).
| Demographics | Rating | Rank | Single Mother Households |
| Immigrants | Poland | 96.3 /100 | #99 | Exceptional 5.8% |
| Scandinavians | 96.2 /100 | #100 | Exceptional 5.8% |
| Germans | 96.2 /100 | #101 | Exceptional 5.8% |
| English | 96.2 /100 | #102 | Exceptional 5.8% |
| Scottish | 96.2 /100 | #103 | Exceptional 5.8% |
| Northern Europeans | 96.2 /100 | #104 | Exceptional 5.8% |
| Taiwanese | 96.1 /100 | #105 | Exceptional 5.8% |
| Immigrants | Ukraine | 95.9 /100 | #106 | Exceptional 5.8% |
| Paraguayans | 95.8 /100 | #107 | Exceptional 5.8% |
| Immigrants | Italy | 95.8 /100 | #108 | Exceptional 5.8% |
| Immigrants | Western Europe | 95.7 /100 | #109 | Exceptional 5.8% |
| British | 95.5 /100 | #110 | Exceptional 5.8% |
| Immigrants | England | 95.5 /100 | #111 | Exceptional 5.8% |
| Immigrants | Kuwait | 95.4 /100 | #112 | Exceptional 5.8% |
| Mongolians | 95.3 /100 | #113 | Exceptional 5.8% |