Cherokee vs Immigrants from Malaysia Family Households

COMPARE

Cherokee
Race
Ancestry
AfghanAfricanAlaska NativeAlaskan AthabascanAlbanianAleutAlsatianAmericanApacheArabArapahoArgentineanArmenianAssyrian/Chaldean/SyriacAustralianAustrianBahamianBangladeshiBarbadianBasqueBelgianBelizeanBermudanBhutaneseBlackfeetBolivianBrazilianBritishBritish West IndianBulgarianBurmeseCajunCambodianCanadianCape VerdeanCarpatho RusynCelticCentral AmericanCentral American IndianCherokeeCheyenneChickasawChileanChineseChippewaChoctawColombianColvilleComancheCosta RicanCreeCreekCroatianCrowCubanCypriotCzechCzechoslovakianDanishDelawareDominicanDutchDutch West IndianEastern EuropeanEcuadorianEgyptianEnglishEstonianEthiopianEuropeanFijianFilipinoFinnishFrenchFrench American IndianFrench CanadianGermanGerman RussianGhanaianGreekGuamanian/ChamorroGuatemalanGuyaneseHaitianHmongHonduranHopiHoumaHungarianIcelanderIndian (Asian)IndonesianInupiatIranianIraqiIrishIroquoisIsraeliItalianJamaicanJapaneseJordanianKenyanKiowaKoreanLaotianLatvianLebaneseLiberianLithuanianLumbeeLuxembourgerMacedonianMalaysianMalteseMarshalleseMenomineeMexicanMexican American IndianMongolianMoroccanNative HawaiianNavajoNepaleseNew ZealanderNicaraguanNigerianNorthern EuropeanNorwegianOkinawanOsageOttawaPaiutePakistaniPalestinianPanamanianParaguayanPennsylvania GermanPeruvianPimaPolishPortuguesePotawatomiPuebloPuerto RicanPuget Sound SalishRomanianRussianSalvadoranSamoanScandinavianScotch-IrishScottishSeminoleSenegaleseSerbianShoshoneSierra LeoneanSiouxSlavicSlovakSloveneSomaliSouth AfricanSouth AmericanSouth American IndianSoviet UnionSpaniardSpanishSpanish AmericanSpanish American IndianSri LankanSubsaharan AfricanSudaneseSwedishSwissSyrianTaiwaneseThaiTlingit-HaidaTohono O'OdhamTonganTrinidadian and TobagonianTsimshianTurkishU.S. Virgin IslanderUgandanUkrainianUruguayanUteVenezuelanVietnameseWelshWest IndianYakamaYaquiYugoslavianYumanYup'ikZimbabwean
Immigration
NonimmigrantsImmigrantsAfghanistanAfricaAlbaniaArgentinaArmeniaAsiaAustraliaAustriaBahamasBangladeshBarbadosBelarusBelgiumBelizeBoliviaBosnia and HerzegovinaBrazilBulgariaBurma/MyanmarCabo VerdeCambodiaCameroonCanadaCaribbeanCentral AmericaChileChinaColombiaCongoCosta RicaCroatiaCubaCzechoslovakiaDenmarkDominicaDominican RepublicEastern AfricaEastern AsiaEastern EuropeEcuadorEgyptEl SalvadorEnglandEritreaEthiopiaEuropeFijiFranceGermanyGhanaGreeceGrenadaGuatemalaGuyanaHaitiHondurasHong KongHungaryIndiaIndonesiaIranIraqIrelandIsraelItalyJamaicaJapanJordanKazakhstanKenyaKoreaKuwaitLaosLatin AmericaLatviaLebanonLiberiaLithuaniaMexicoMicronesiaMiddle AfricaMoldovaMoroccoNepalNetherlandsNicaraguaNigeriaNorth AmericaNorth MacedoniaNorthern AfricaNorthern EuropeNorwayOceaniaPakistanPanamaPeruPhilippinesPolandPortugalRomaniaRussiaSaudi ArabiaScotlandSenegalSerbiaSierra LeoneSingaporeSomaliaSouth AfricaSouth AmericaSouth Central AsiaSouth Eastern AsiaSouthern EuropeSpainSri LankaSt. Vincent and the GrenadinesSudanSwedenSwitzerlandSyriaTaiwanThailandTrinidad and TobagoTurkeyUgandaUkraineUruguayUzbekistanVenezuelaVietnamWest IndiesWestern AfricaWestern AsiaWestern EuropeYemenZaireZimbabweAzores
Immigrants from Malaysia
Race
Ancestry
AfghanAfricanAlaska NativeAlaskan AthabascanAlbanianAleutAlsatianAmericanApacheArabArapahoArgentineanArmenianAssyrian/Chaldean/SyriacAustralianAustrianBahamianBangladeshiBarbadianBasqueBelgianBelizeanBermudanBhutaneseBlackfeetBolivianBrazilianBritishBritish West IndianBulgarianBurmeseCajunCambodianCanadianCape VerdeanCarpatho RusynCelticCentral AmericanCentral American IndianCheyenneChickasawChileanChineseChippewaChoctawColombianColvilleComancheCosta RicanCreeCreekCroatianCrowCubanCypriotCzechCzechoslovakianDanishDelawareDominicanDutchDutch West IndianEastern EuropeanEcuadorianEgyptianEnglishEstonianEthiopianEuropeanFijianFilipinoFinnishFrenchFrench American IndianFrench CanadianGermanGerman RussianGhanaianGreekGuamanian/ChamorroGuatemalanGuyaneseHaitianHmongHonduranHopiHoumaHungarianIcelanderIndian (Asian)IndonesianInupiatIranianIraqiIrishIroquoisIsraeliItalianJamaicanJapaneseJordanianKenyanKiowaKoreanLaotianLatvianLebaneseLiberianLithuanianLumbeeLuxembourgerMacedonianMalaysianMalteseMarshalleseMenomineeMexicanMexican American IndianMongolianMoroccanNative HawaiianNavajoNepaleseNew ZealanderNicaraguanNigerianNorthern EuropeanNorwegianOkinawanOsageOttawaPaiutePakistaniPalestinianPanamanianParaguayanPennsylvania GermanPeruvianPimaPolishPortuguesePotawatomiPuebloPuerto RicanPuget Sound SalishRomanianRussianSalvadoranSamoanScandinavianScotch-IrishScottishSeminoleSenegaleseSerbianShoshoneSierra LeoneanSiouxSlavicSlovakSloveneSomaliSouth AfricanSouth AmericanSouth American IndianSoviet UnionSpaniardSpanishSpanish AmericanSpanish American IndianSri LankanSubsaharan AfricanSudaneseSwedishSwissSyrianTaiwaneseThaiTlingit-HaidaTohono O'OdhamTonganTrinidadian and TobagonianTsimshianTurkishU.S. Virgin IslanderUgandanUkrainianUruguayanUteVenezuelanVietnameseWelshWest IndianYakamaYaquiYugoslavianYumanYup'ikZimbabwean
Immigration
NonimmigrantsImmigrantsAfghanistanAfricaAlbaniaArgentinaArmeniaAsiaAustraliaAustriaBahamasBangladeshBarbadosBelarusBelgiumBelizeBoliviaBosnia and HerzegovinaBrazilBulgariaBurma/MyanmarCabo VerdeCambodiaCameroonCanadaCaribbeanCentral AmericaChileChinaColombiaCongoCosta RicaCroatiaCubaCzechoslovakiaDenmarkDominicaDominican RepublicEastern AfricaEastern AsiaEastern EuropeEcuadorEgyptEl SalvadorEnglandEritreaEthiopiaEuropeFijiFranceGermanyGhanaGreeceGrenadaGuatemalaGuyanaHaitiHondurasHong KongHungaryIndiaIndonesiaIranIraqIrelandIsraelItalyJamaicaJapanJordanKazakhstanKenyaKoreaKuwaitLaosLatin AmericaLatviaLebanonLiberiaLithuaniaMalaysiaMexicoMicronesiaMiddle AfricaMoldovaMoroccoNepalNetherlandsNicaraguaNigeriaNorth AmericaNorth MacedoniaNorthern AfricaNorthern EuropeNorwayOceaniaPakistanPanamaPeruPhilippinesPolandPortugalRomaniaRussiaSaudi ArabiaScotlandSenegalSerbiaSierra LeoneSingaporeSomaliaSouth AfricaSouth AmericaSouth Central AsiaSouth Eastern AsiaSouthern EuropeSpainSri LankaSt. Vincent and the GrenadinesSudanSwedenSwitzerlandSyriaTaiwanThailandTrinidad and TobagoTurkeyUgandaUkraineUruguayUzbekistanVenezuelaVietnamWest IndiesWestern AfricaWestern AsiaWestern EuropeYemenZaireZimbabweAzores
Family Households
Income
Poverty
Unemployment
Labor Participation
Family Structure
Vehicle Availability
Education Level
Disability

Family Households Comparison

Cherokee

Immigrants from Malaysia

Exceptional
Poor
65.0%
FAMILY HOUSEHOLDS
95.3/ 100
METRIC RATING
117th/ 347
METRIC RANK
64.0%
FAMILY HOUSEHOLDS
17.9/ 100
METRIC RATING
200th/ 347
METRIC RANK

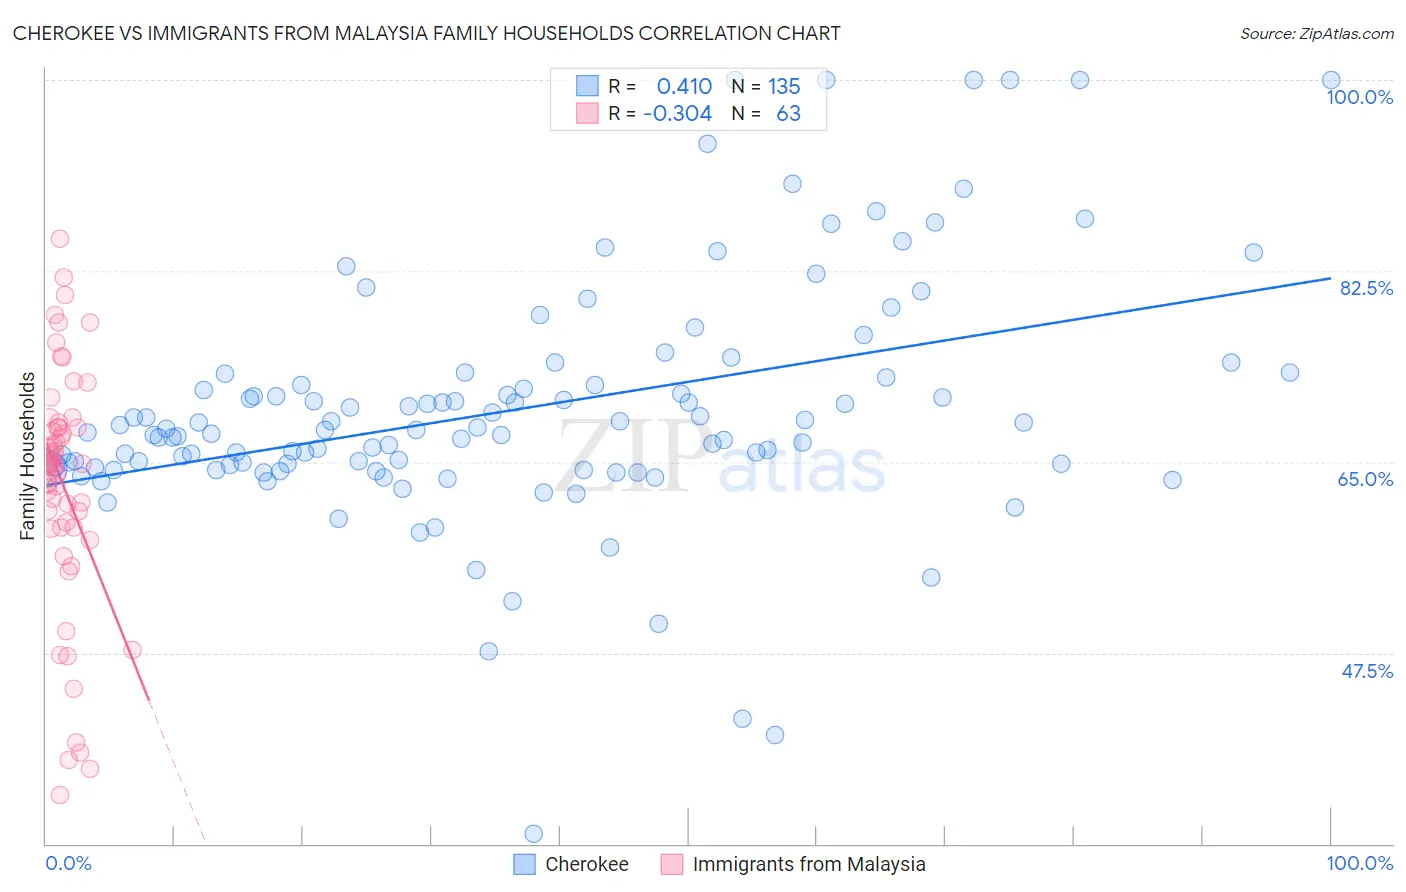
Cherokee vs Immigrants from Malaysia Family Households Correlation Chart

The statistical analysis conducted on geographies consisting of 493,383,151 people shows a moderate positive correlation between the proportion of Cherokee and percentage of family households in the United States with a correlation coefficient (R) of 0.410 and weighted average of 65.0%. Similarly, the statistical analysis conducted on geographies consisting of 197,925,894 people shows a mild negative correlation between the proportion of Immigrants from Malaysia and percentage of family households in the United States with a correlation coefficient (R) of -0.304 and weighted average of 64.0%, a difference of 1.5%.
Cherokee vs Immigrants from Malaysia Family Households

Family Households Correlation Summary

MeasurementCherokeeImmigrants from Malaysia
Minimum31.0%34.5%
Maximum100.0%85.4%
Range69.0%50.9%
Mean69.9%62.8%
Median67.9%64.8%
Interquartile 25% (IQ1)64.5%59.0%
Interquartile 75% (IQ3)72.7%68.2%
Interquartile Range (IQR)8.2%9.2%
Standard Deviation (Sample)11.2%11.1%
Standard Deviation (Population)11.2%11.0%

Similar Demographics by Family Households

Demographics Similar to Cherokee by Family Households

In terms of family households, the demographic groups most similar to Cherokee are Immigrants from Iraq (65.0%, a difference of 0.0%), Ecuadorian (65.0%, a difference of 0.010%), Dutch (64.9%, a difference of 0.020%), Argentinean (65.0%, a difference of 0.030%), and Immigrants from Eastern Asia (64.9%, a difference of 0.060%).
DemographicsRating | RankFamily Households
Scandinavians
96.8
/100
|
#110
Exceptional
65.0%
Europeans
96.8
/100
|
#111
Exceptional
65.0%
Immigrants | Jordan
96.5
/100
|
#112
Exceptional
65.0%
Spanish
96.2
/100
|
#113
Exceptional
65.0%
Argentineans
95.7
/100
|
#114
Exceptional
65.0%
Ecuadorians
95.4
/100
|
#115
Exceptional
65.0%
Immigrants | Iraq
95.4
/100
|
#116
Exceptional
65.0%
Cherokee
95.3
/100
|
#117
Exceptional
65.0%
Dutch
95.1
/100
|
#118
Exceptional
64.9%
Immigrants | Eastern Asia
94.4
/100
|
#119
Exceptional
64.9%
Immigrants | Oceania
94.2
/100
|
#120
Exceptional
64.9%
Hungarians
94.0
/100
|
#121
Exceptional
64.9%
Hmong
93.4
/100
|
#122
Exceptional
64.9%
Choctaw
93.4
/100
|
#123
Exceptional
64.9%
Immigrants | Argentina
92.8
/100
|
#124
Exceptional
64.9%

Demographics Similar to Immigrants from Malaysia by Family Households

In terms of family households, the demographic groups most similar to Immigrants from Malaysia are Seminole (64.0%, a difference of 0.020%), Polish (64.0%, a difference of 0.020%), Slavic (64.0%, a difference of 0.020%), Immigrants from Eastern Europe (64.0%, a difference of 0.020%), and Immigrants from Canada (64.0%, a difference of 0.030%).
DemographicsRating | RankFamily Households
French
23.7
/100
|
#193
Fair
64.0%
Paiute
22.2
/100
|
#194
Fair
64.0%
Immigrants | North America
20.0
/100
|
#195
Poor
64.0%
Immigrants | Canada
19.2
/100
|
#196
Poor
64.0%
Seminole
18.9
/100
|
#197
Poor
64.0%
Poles
18.9
/100
|
#198
Poor
64.0%
Slavs
18.6
/100
|
#199
Poor
64.0%
Immigrants | Malaysia
17.9
/100
|
#200
Poor
64.0%
Immigrants | Eastern Europe
17.2
/100
|
#201
Poor
64.0%
Iranians
13.5
/100
|
#202
Poor
63.9%
Norwegians
13.2
/100
|
#203
Poor
63.9%
Immigrants | Uruguay
12.8
/100
|
#204
Poor
63.9%
Brazilians
12.4
/100
|
#205
Poor
63.9%
Immigrants | Lithuania
12.1
/100
|
#206
Poor
63.9%
Nigerians
11.5
/100
|
#207
Poor
63.9%