Belizean vs Immigrants from Bahamas Single Male Poverty
COMPARE
Belizean
Immigrants from Bahamas
Single Male Poverty
Single Male Poverty Comparison
Belizeans
Immigrants from Bahamas
13.4%
SINGLE MALE POVERTY
2.3/ 100
METRIC RATING
240th/ 347
METRIC RANK
14.4%
SINGLE MALE POVERTY
0.0/ 100
METRIC RATING
284th/ 347
METRIC RANK
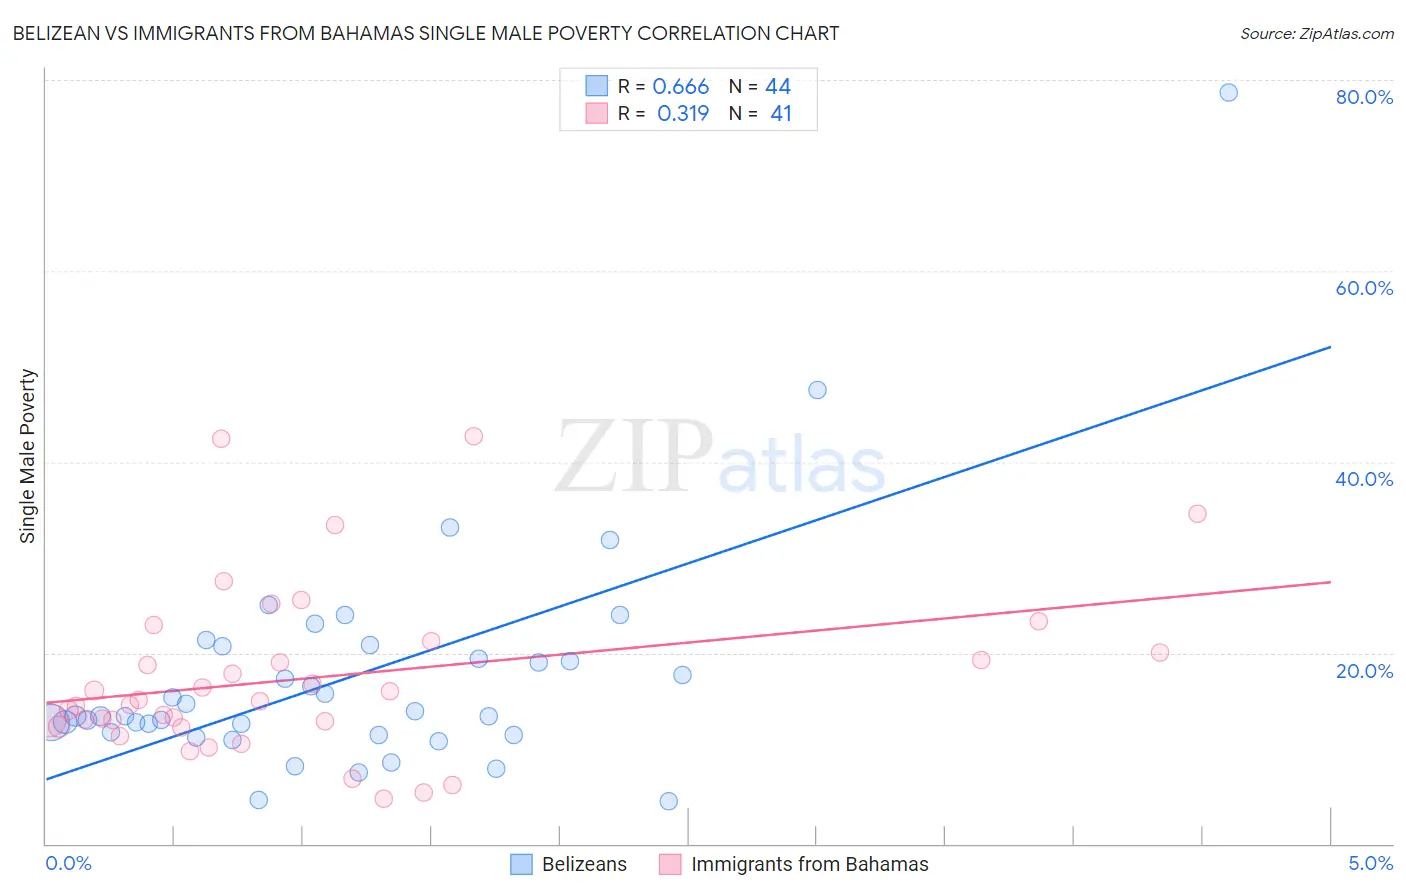
Belizean vs Immigrants from Bahamas Single Male Poverty Correlation Chart
The statistical analysis conducted on geographies consisting of 138,781,129 people shows a significant positive correlation between the proportion of Belizeans and poverty level among single males in the United States with a correlation coefficient (R) of 0.666 and weighted average of 13.4%. Similarly, the statistical analysis conducted on geographies consisting of 101,111,257 people shows a mild positive correlation between the proportion of Immigrants from Bahamas and poverty level among single males in the United States with a correlation coefficient (R) of 0.319 and weighted average of 14.4%, a difference of 7.3%.
Single Male Poverty Correlation Summary
| Measurement | Belizean | Immigrants from Bahamas |
| Minimum | 4.5% | 4.7% |
| Maximum | 78.7% | 42.7% |
| Range | 74.2% | 38.1% |
| Mean | 17.5% | 17.4% |
| Median | 13.4% | 14.9% |
| Interquartile 25% (IQ1) | 11.5% | 12.5% |
| Interquartile 75% (IQ3) | 20.0% | 20.6% |
| Interquartile Range (IQR) | 8.5% | 8.1% |
| Standard Deviation (Sample) | 12.3% | 8.8% |
| Standard Deviation (Population) | 12.2% | 8.7% |
Similar Demographics by Single Male Poverty
Demographics Similar to Belizeans by Single Male Poverty
In terms of single male poverty, the demographic groups most similar to Belizeans are Immigrants from Germany (13.4%, a difference of 0.11%), Carpatho Rusyn (13.4%, a difference of 0.12%), Barbadian (13.4%, a difference of 0.17%), Czechoslovakian (13.4%, a difference of 0.30%), and Immigrants from Ghana (13.4%, a difference of 0.39%).
| Demographics | Rating | Rank | Single Male Poverty |
| British | 4.0 /100 | #233 | Tragic 13.3% |
| Canadians | 4.0 /100 | #234 | Tragic 13.3% |
| Bangladeshis | 3.7 /100 | #235 | Tragic 13.3% |
| Luxembourgers | 3.6 /100 | #236 | Tragic 13.4% |
| British West Indians | 3.4 /100 | #237 | Tragic 13.4% |
| Immigrants | Ghana | 3.2 /100 | #238 | Tragic 13.4% |
| Czechoslovakians | 3.0 /100 | #239 | Tragic 13.4% |
| Belizeans | 2.3 /100 | #240 | Tragic 13.4% |
| Immigrants | Germany | 2.1 /100 | #241 | Tragic 13.4% |
| Carpatho Rusyns | 2.1 /100 | #242 | Tragic 13.4% |
| Barbadians | 2.1 /100 | #243 | Tragic 13.4% |
| Immigrants | Senegal | 1.7 /100 | #244 | Tragic 13.5% |
| Immigrants | Latin America | 1.3 /100 | #245 | Tragic 13.5% |
| Immigrants | Micronesia | 1.2 /100 | #246 | Tragic 13.5% |
| Belgians | 1.2 /100 | #247 | Tragic 13.5% |
Demographics Similar to Immigrants from Bahamas by Single Male Poverty
In terms of single male poverty, the demographic groups most similar to Immigrants from Bahamas are French (14.4%, a difference of 0.13%), Celtic (14.5%, a difference of 0.46%), Iroquois (14.5%, a difference of 0.58%), White/Caucasian (14.5%, a difference of 0.59%), and Immigrants from Dominica (14.5%, a difference of 0.67%).
| Demographics | Rating | Rank | Single Male Poverty |
| Immigrants | Honduras | 0.0 /100 | #277 | Tragic 14.1% |
| Slovaks | 0.0 /100 | #278 | Tragic 14.1% |
| Indonesians | 0.0 /100 | #279 | Tragic 14.1% |
| Hmong | 0.0 /100 | #280 | Tragic 14.2% |
| Hispanics or Latinos | 0.0 /100 | #281 | Tragic 14.2% |
| Spanish Americans | 0.0 /100 | #282 | Tragic 14.2% |
| Yaqui | 0.0 /100 | #283 | Tragic 14.2% |
| Immigrants | Bahamas | 0.0 /100 | #284 | Tragic 14.4% |
| French | 0.0 /100 | #285 | Tragic 14.4% |
| Celtics | 0.0 /100 | #286 | Tragic 14.5% |
| Iroquois | 0.0 /100 | #287 | Tragic 14.5% |
| Whites/Caucasians | 0.0 /100 | #288 | Tragic 14.5% |
| Immigrants | Dominica | 0.0 /100 | #289 | Tragic 14.5% |
| U.S. Virgin Islanders | 0.0 /100 | #290 | Tragic 14.5% |
| Bahamians | 0.0 /100 | #291 | Tragic 14.6% |