Syrian vs Hungarian 11th Grade

COMPARE

Syrian
Race
Ancestry
AfghanAfricanAlaska NativeAlaskan AthabascanAlbanianAleutAlsatianAmericanApacheArabArapahoArgentineanArmenianAssyrian/Chaldean/SyriacAustralianAustrianBahamianBangladeshiBarbadianBasqueBelgianBelizeanBermudanBhutaneseBlackfeetBolivianBrazilianBritishBritish West IndianBulgarianBurmeseCajunCambodianCanadianCape VerdeanCarpatho RusynCelticCentral AmericanCentral American IndianCherokeeCheyenneChickasawChileanChineseChippewaChoctawColombianColvilleComancheCosta RicanCreeCreekCroatianCrowCubanCypriotCzechCzechoslovakianDanishDelawareDominicanDutchDutch West IndianEastern EuropeanEcuadorianEgyptianEnglishEstonianEthiopianEuropeanFijianFilipinoFinnishFrenchFrench American IndianFrench CanadianGermanGerman RussianGhanaianGreekGuamanian/ChamorroGuatemalanGuyaneseHaitianHmongHonduranHopiHoumaIcelanderIndian (Asian)IndonesianInupiatIranianIraqiIrishIroquoisIsraeliItalianJamaicanJapaneseJordanianKenyanKiowaKoreanLaotianLatvianLebaneseLiberianLithuanianLumbeeLuxembourgerMacedonianMalaysianMalteseMarshalleseMenomineeMexicanMexican American IndianMongolianMoroccanNative HawaiianNavajoNepaleseNew ZealanderNicaraguanNigerianNorthern EuropeanNorwegianOkinawanOsageOttawaPaiutePakistaniPalestinianPanamanianParaguayanPennsylvania GermanPeruvianPimaPolishPortuguesePotawatomiPuebloPuerto RicanPuget Sound SalishRomanianRussianSalvadoranSamoanScandinavianScotch-IrishScottishSeminoleSenegaleseSerbianShoshoneSierra LeoneanSiouxSlavicSlovakSloveneSomaliSouth AfricanSouth AmericanSouth American IndianSoviet UnionSpaniardSpanishSpanish AmericanSpanish American IndianSri LankanSubsaharan AfricanSudaneseSwedishSwissSyrianTaiwaneseThaiTlingit-HaidaTohono O'OdhamTonganTrinidadian and TobagonianTsimshianTurkishU.S. Virgin IslanderUgandanUkrainianUruguayanUteVenezuelanVietnameseWelshWest IndianYakamaYaquiYugoslavianYumanYup'ikZimbabwean
Immigration
NonimmigrantsImmigrantsAfghanistanAfricaAlbaniaArgentinaArmeniaAsiaAustraliaAustriaBahamasBangladeshBarbadosBelarusBelgiumBelizeBoliviaBosnia and HerzegovinaBrazilBulgariaBurma/MyanmarCabo VerdeCambodiaCameroonCanadaCaribbeanCentral AmericaChileChinaColombiaCongoCosta RicaCroatiaCubaCzechoslovakiaDenmarkDominicaDominican RepublicEastern AfricaEastern AsiaEastern EuropeEcuadorEgyptEl SalvadorEnglandEritreaEthiopiaEuropeFijiFranceGermanyGhanaGreeceGrenadaGuatemalaGuyanaHaitiHondurasHong KongHungaryIndiaIndonesiaIranIraqIrelandIsraelItalyJamaicaJapanJordanKazakhstanKenyaKoreaKuwaitLaosLatin AmericaLatviaLebanonLiberiaLithuaniaMalaysiaMexicoMicronesiaMiddle AfricaMoldovaMoroccoNepalNetherlandsNicaraguaNigeriaNorth AmericaNorth MacedoniaNorthern AfricaNorthern EuropeNorwayOceaniaPakistanPanamaPeruPhilippinesPolandPortugalRomaniaRussiaSaudi ArabiaScotlandSenegalSerbiaSierra LeoneSingaporeSomaliaSouth AfricaSouth AmericaSouth Central AsiaSouth Eastern AsiaSouthern EuropeSpainSri LankaSt. Vincent and the GrenadinesSudanSwedenSwitzerlandSyriaTaiwanThailandTrinidad and TobagoTurkeyUgandaUkraineUruguayUzbekistanVenezuelaVietnamWest IndiesWestern AfricaWestern AsiaWestern EuropeYemenZaireZimbabweAzores
Hungarian
Race
Ancestry
AfghanAfricanAlaska NativeAlaskan AthabascanAlbanianAleutAlsatianAmericanApacheArabArapahoArgentineanArmenianAssyrian/Chaldean/SyriacAustralianAustrianBahamianBangladeshiBarbadianBasqueBelgianBelizeanBermudanBhutaneseBlackfeetBolivianBrazilianBritishBritish West IndianBulgarianBurmeseCajunCambodianCanadianCape VerdeanCarpatho RusynCelticCentral AmericanCentral American IndianCherokeeCheyenneChickasawChileanChineseChippewaChoctawColombianColvilleComancheCosta RicanCreeCreekCroatianCrowCubanCypriotCzechCzechoslovakianDanishDelawareDominicanDutchDutch West IndianEastern EuropeanEcuadorianEgyptianEnglishEstonianEthiopianEuropeanFijianFilipinoFinnishFrenchFrench American IndianFrench CanadianGermanGerman RussianGhanaianGreekGuamanian/ChamorroGuatemalanGuyaneseHaitianHmongHonduranHopiHoumaHungarianIcelanderIndian (Asian)IndonesianInupiatIranianIraqiIrishIroquoisIsraeliItalianJamaicanJapaneseJordanianKenyanKiowaKoreanLaotianLatvianLebaneseLiberianLithuanianLumbeeLuxembourgerMacedonianMalaysianMalteseMarshalleseMenomineeMexicanMexican American IndianMongolianMoroccanNative HawaiianNavajoNepaleseNew ZealanderNicaraguanNigerianNorthern EuropeanNorwegianOkinawanOsageOttawaPaiutePakistaniPalestinianPanamanianParaguayanPennsylvania GermanPeruvianPimaPolishPortuguesePotawatomiPuebloPuerto RicanPuget Sound SalishRomanianRussianSalvadoranSamoanScandinavianScotch-IrishScottishSeminoleSenegaleseSerbianShoshoneSierra LeoneanSiouxSlavicSlovakSloveneSomaliSouth AfricanSouth AmericanSouth American IndianSoviet UnionSpaniardSpanishSpanish AmericanSpanish American IndianSri LankanSubsaharan AfricanSudaneseSwedishSwissTaiwaneseThaiTlingit-HaidaTohono O'OdhamTonganTrinidadian and TobagonianTsimshianTurkishU.S. Virgin IslanderUgandanUkrainianUruguayanUteVenezuelanVietnameseWelshWest IndianYakamaYaquiYugoslavianYumanYup'ikZimbabwean
Immigration
NonimmigrantsImmigrantsAfghanistanAfricaAlbaniaArgentinaArmeniaAsiaAustraliaAustriaBahamasBangladeshBarbadosBelarusBelgiumBelizeBoliviaBosnia and HerzegovinaBrazilBulgariaBurma/MyanmarCabo VerdeCambodiaCameroonCanadaCaribbeanCentral AmericaChileChinaColombiaCongoCosta RicaCroatiaCubaCzechoslovakiaDenmarkDominicaDominican RepublicEastern AfricaEastern AsiaEastern EuropeEcuadorEgyptEl SalvadorEnglandEritreaEthiopiaEuropeFijiFranceGermanyGhanaGreeceGrenadaGuatemalaGuyanaHaitiHondurasHong KongHungaryIndiaIndonesiaIranIraqIrelandIsraelItalyJamaicaJapanJordanKazakhstanKenyaKoreaKuwaitLaosLatin AmericaLatviaLebanonLiberiaLithuaniaMalaysiaMexicoMicronesiaMiddle AfricaMoldovaMoroccoNepalNetherlandsNicaraguaNigeriaNorth AmericaNorth MacedoniaNorthern AfricaNorthern EuropeNorwayOceaniaPakistanPanamaPeruPhilippinesPolandPortugalRomaniaRussiaSaudi ArabiaScotlandSenegalSerbiaSierra LeoneSingaporeSomaliaSouth AfricaSouth AmericaSouth Central AsiaSouth Eastern AsiaSouthern EuropeSpainSri LankaSt. Vincent and the GrenadinesSudanSwedenSwitzerlandSyriaTaiwanThailandTrinidad and TobagoTurkeyUgandaUkraineUruguayUzbekistanVenezuelaVietnamWest IndiesWestern AfricaWestern AsiaWestern EuropeYemenZaireZimbabweAzores
11th Grade
Income
Poverty
Unemployment
Labor Participation
Family Structure
Vehicle Availability
Education Level
Disability

11th Grade Comparison

Syrians

Hungarians

Exceptional
Exceptional
93.4%
11TH GRADE
98.4/ 100
METRIC RATING
110th/ 347
METRIC RANK
94.2%
11TH GRADE
99.9/ 100
METRIC RATING
38th/ 347
METRIC RANK

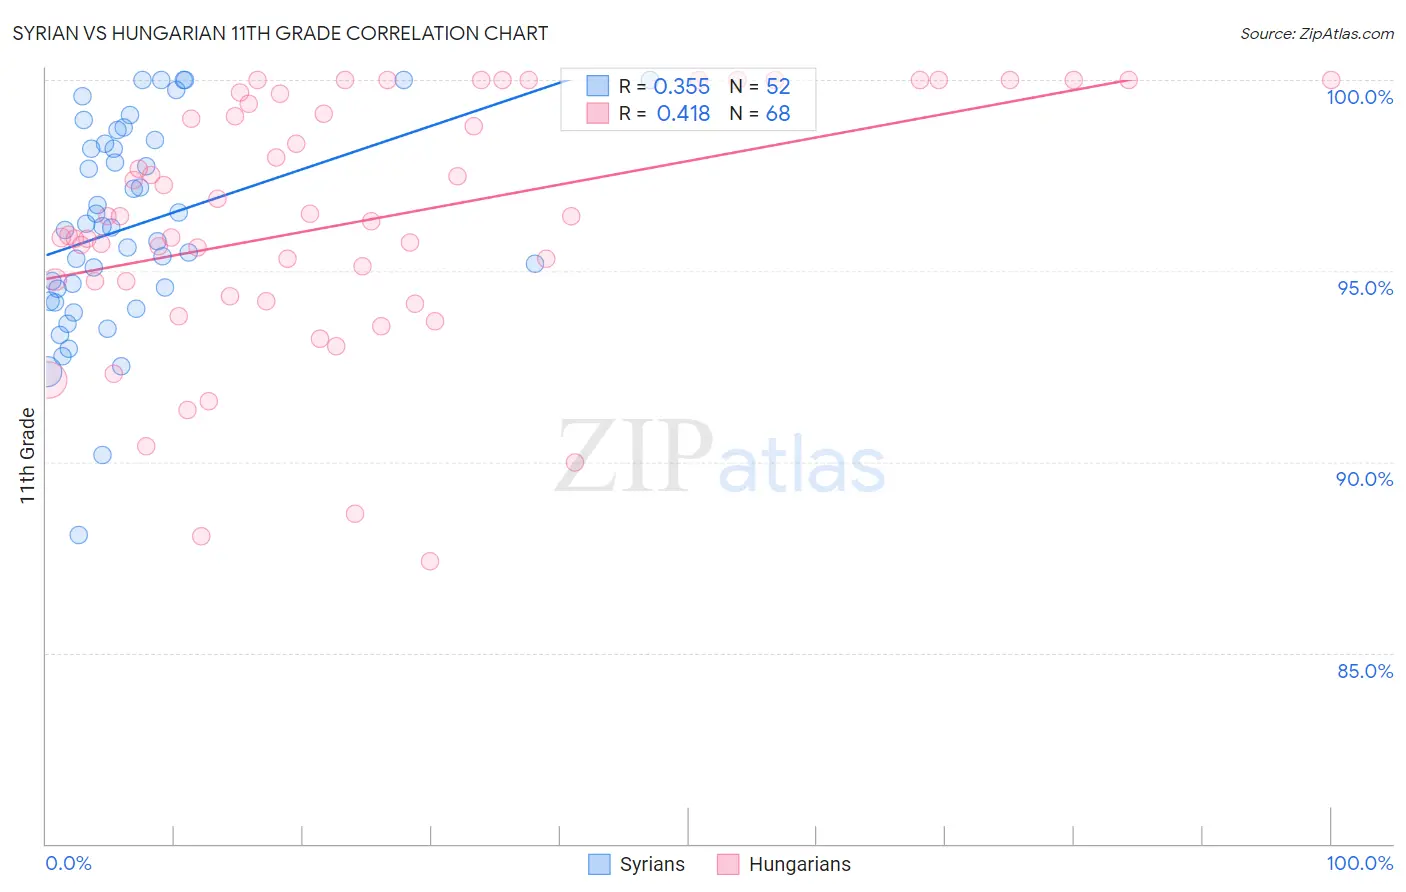
Syrian vs Hungarian 11th Grade Correlation Chart

The statistical analysis conducted on geographies consisting of 266,305,988 people shows a mild positive correlation between the proportion of Syrians and percentage of population with at least 11th grade education in the United States with a correlation coefficient (R) of 0.355 and weighted average of 93.4%. Similarly, the statistical analysis conducted on geographies consisting of 486,240,885 people shows a moderate positive correlation between the proportion of Hungarians and percentage of population with at least 11th grade education in the United States with a correlation coefficient (R) of 0.418 and weighted average of 94.2%, a difference of 0.79%.
Syrian vs Hungarian 11th Grade

11th Grade Correlation Summary

MeasurementSyrianHungarian
Minimum88.1%87.4%
Maximum100.0%100.0%
Range11.9%12.6%
Mean96.2%96.3%
Median96.2%96.4%
Interquartile 25% (IQ1)94.4%94.5%
Interquartile 75% (IQ3)98.4%99.5%
Interquartile Range (IQR)4.0%5.0%
Standard Deviation (Sample)2.7%3.3%
Standard Deviation (Population)2.7%3.2%

Similar Demographics by 11th Grade

Demographics Similar to Syrians by 11th Grade

In terms of 11th grade, the demographic groups most similar to Syrians are Immigrants from Norway (93.5%, a difference of 0.010%), Alaska Native (93.5%, a difference of 0.010%), Immigrants from Kuwait (93.5%, a difference of 0.010%), Lebanese (93.5%, a difference of 0.040%), and Immigrants from Europe (93.5%, a difference of 0.040%).
DemographicsRating | Rank11th Grade
Lebanese
98.6
/100
|
#103
Exceptional
93.5%
Immigrants | Europe
98.6
/100
|
#104
Exceptional
93.5%
Immigrants | Serbia
98.6
/100
|
#105
Exceptional
93.5%
Immigrants | Croatia
98.6
/100
|
#106
Exceptional
93.5%
Immigrants | Norway
98.4
/100
|
#107
Exceptional
93.5%
Alaska Natives
98.4
/100
|
#108
Exceptional
93.5%
Immigrants | Kuwait
98.4
/100
|
#109
Exceptional
93.5%
Syrians
98.4
/100
|
#110
Exceptional
93.4%
Yugoslavians
98.1
/100
|
#111
Exceptional
93.4%
Immigrants | Germany
98.0
/100
|
#112
Exceptional
93.4%
Immigrants | Zimbabwe
97.8
/100
|
#113
Exceptional
93.4%
Jordanians
97.8
/100
|
#114
Exceptional
93.4%
Palestinians
97.7
/100
|
#115
Exceptional
93.4%
Immigrants | Hungary
97.5
/100
|
#116
Exceptional
93.4%
Whites/Caucasians
97.4
/100
|
#117
Exceptional
93.3%

Demographics Similar to Hungarians by 11th Grade

In terms of 11th grade, the demographic groups most similar to Hungarians are Northern European (94.2%, a difference of 0.0%), Immigrants from Singapore (94.2%, a difference of 0.010%), Immigrants from Northern Europe (94.2%, a difference of 0.010%), British (94.2%, a difference of 0.020%), and Immigrants from Scotland (94.2%, a difference of 0.020%).
DemographicsRating | Rank11th Grade
Welsh
99.9
/100
|
#31
Exceptional
94.2%
Belgians
99.9
/100
|
#32
Exceptional
94.2%
British
99.9
/100
|
#33
Exceptional
94.2%
Immigrants | Scotland
99.9
/100
|
#34
Exceptional
94.2%
Immigrants | Singapore
99.9
/100
|
#35
Exceptional
94.2%
Immigrants | Northern Europe
99.9
/100
|
#36
Exceptional
94.2%
Northern Europeans
99.9
/100
|
#37
Exceptional
94.2%
Hungarians
99.9
/100
|
#38
Exceptional
94.2%
Immigrants | Lithuania
99.9
/100
|
#39
Exceptional
94.1%
Thais
99.9
/100
|
#40
Exceptional
94.1%
Cypriots
99.9
/100
|
#41
Exceptional
94.1%
Immigrants | Austria
99.9
/100
|
#42
Exceptional
94.1%
Greeks
99.9
/100
|
#43
Exceptional
94.1%
Immigrants | Ireland
99.9
/100
|
#44
Exceptional
94.1%
Australians
99.9
/100
|
#45
Exceptional
94.1%