Syrian vs Hungarian Single Father Households
COMPARE
Syrian
Hungarian
Single Father Households
Single Father Households Comparison
Syrians
Hungarians
2.2%
SINGLE FATHER HOUSEHOLDS
94.8/ 100
METRIC RATING
135th/ 347
METRIC RANK
2.2%
SINGLE FATHER HOUSEHOLDS
97.9/ 100
METRIC RATING
117th/ 347
METRIC RANK
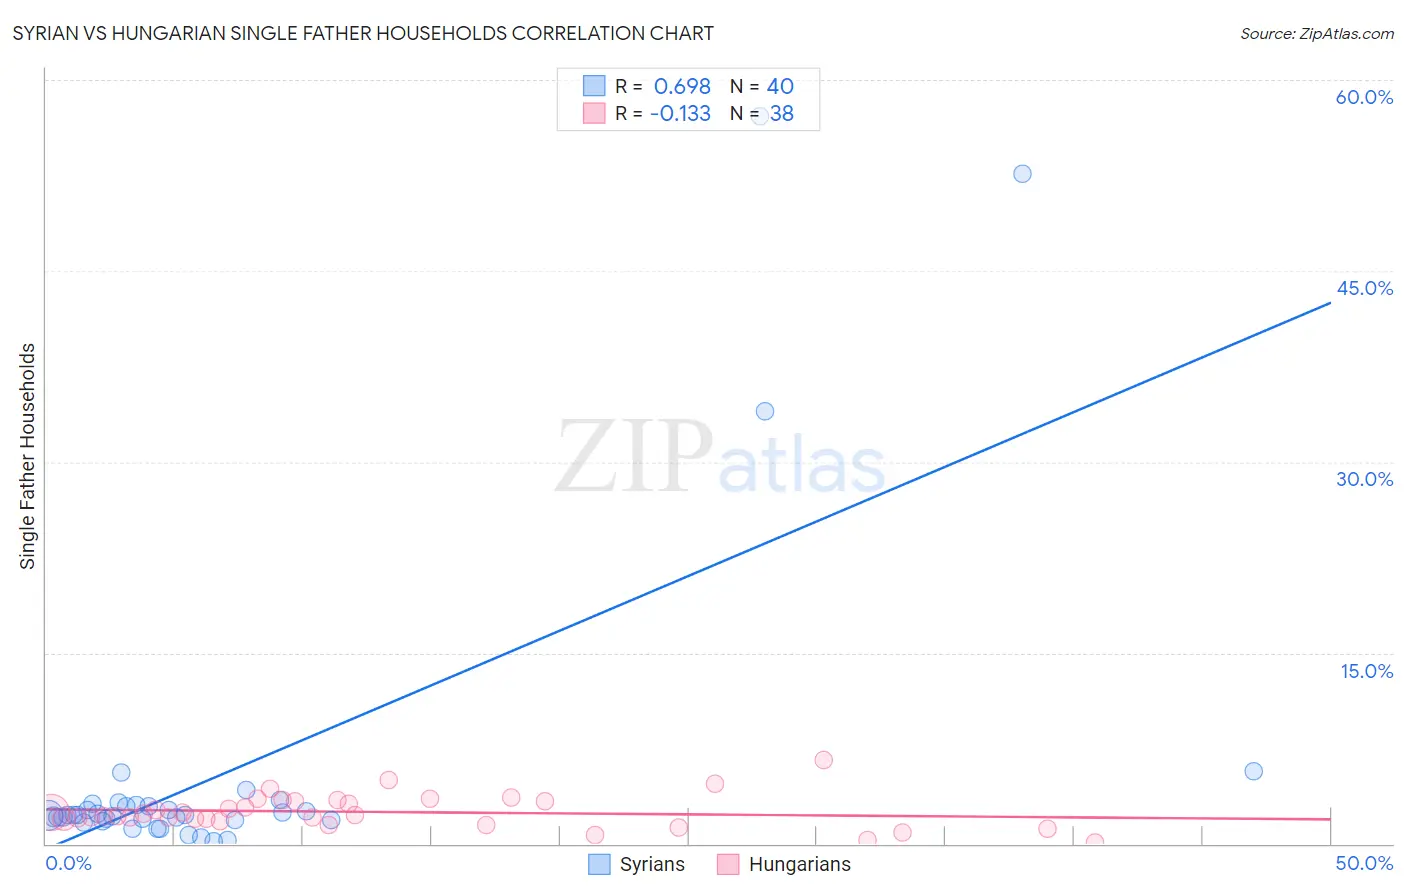
Syrian vs Hungarian Single Father Households Correlation Chart
The statistical analysis conducted on geographies consisting of 264,617,959 people shows a significant positive correlation between the proportion of Syrians and percentage of single father households in the United States with a correlation coefficient (R) of 0.698 and weighted average of 2.2%. Similarly, the statistical analysis conducted on geographies consisting of 478,655,062 people shows a poor negative correlation between the proportion of Hungarians and percentage of single father households in the United States with a correlation coefficient (R) of -0.133 and weighted average of 2.2%, a difference of 1.9%.
Single Father Households Correlation Summary
| Measurement | Syrian | Hungarian |
| Minimum | 0.16% | 0.13% |
| Maximum | 57.1% | 6.6% |
| Range | 57.0% | 6.5% |
| Mean | 5.7% | 2.5% |
| Median | 2.2% | 2.2% |
| Interquartile 25% (IQ1) | 1.9% | 1.9% |
| Interquartile 75% (IQ3) | 3.0% | 3.3% |
| Interquartile Range (IQR) | 1.1% | 1.4% |
| Standard Deviation (Sample) | 12.5% | 1.3% |
| Standard Deviation (Population) | 12.4% | 1.3% |
Demographics Similar to Syrians and Hungarians by Single Father Households
In terms of single father households, the demographic groups most similar to Syrians are Zimbabwean (2.2%, a difference of 0.11%), Chilean (2.2%, a difference of 0.12%), Taiwanese (2.2%, a difference of 0.71%), Polish (2.2%, a difference of 0.82%), and Immigrants from Jordan (2.2%, a difference of 0.84%). Similarly, the demographic groups most similar to Hungarians are Immigrants from Morocco (2.2%, a difference of 0.10%), Trinidadian and Tobagonian (2.2%, a difference of 0.16%), Immigrants from Argentina (2.2%, a difference of 0.19%), Australian (2.2%, a difference of 0.19%), and Immigrants from Brazil (2.2%, a difference of 0.19%).
| Demographics | Rating | Rank | Single Father Households |
| Immigrants | Argentina | 98.1 /100 | #116 | Exceptional 2.2% |
| Hungarians | 97.9 /100 | #117 | Exceptional 2.2% |
| Immigrants | Morocco | 97.8 /100 | #118 | Exceptional 2.2% |
| Trinidadians and Tobagonians | 97.8 /100 | #119 | Exceptional 2.2% |
| Australians | 97.7 /100 | #120 | Exceptional 2.2% |
| Immigrants | Brazil | 97.7 /100 | #121 | Exceptional 2.2% |
| Immigrants | Iraq | 97.6 /100 | #122 | Exceptional 2.2% |
| Immigrants | Yemen | 97.5 /100 | #123 | Exceptional 2.2% |
| British West Indians | 97.4 /100 | #124 | Exceptional 2.2% |
| Immigrants | Indonesia | 97.4 /100 | #125 | Exceptional 2.2% |
| Moroccans | 96.9 /100 | #126 | Exceptional 2.2% |
| Jordanians | 96.9 /100 | #127 | Exceptional 2.2% |
| Immigrants | England | 96.8 /100 | #128 | Exceptional 2.2% |
| Serbians | 96.8 /100 | #129 | Exceptional 2.2% |
| Immigrants | Chile | 96.7 /100 | #130 | Exceptional 2.2% |
| Immigrants | Jordan | 96.6 /100 | #131 | Exceptional 2.2% |
| Poles | 96.5 /100 | #132 | Exceptional 2.2% |
| Taiwanese | 96.3 /100 | #133 | Exceptional 2.2% |
| Zimbabweans | 95.1 /100 | #134 | Exceptional 2.2% |
| Syrians | 94.8 /100 | #135 | Exceptional 2.2% |
| Chileans | 94.5 /100 | #136 | Exceptional 2.2% |