Syrian vs Cape Verdean 11th Grade

COMPARE

Syrian
Race
Ancestry
AfghanAfricanAlaska NativeAlaskan AthabascanAlbanianAleutAlsatianAmericanApacheArabArapahoArgentineanArmenianAssyrian/Chaldean/SyriacAustralianAustrianBahamianBangladeshiBarbadianBasqueBelgianBelizeanBermudanBhutaneseBlackfeetBolivianBrazilianBritishBritish West IndianBulgarianBurmeseCajunCambodianCanadianCarpatho RusynCelticCentral AmericanCentral American IndianCherokeeCheyenneChickasawChileanChineseChippewaChoctawColombianColvilleComancheCosta RicanCreeCreekCroatianCrowCubanCypriotCzechCzechoslovakianDanishDelawareDominicanDutchDutch West IndianEastern EuropeanEcuadorianEgyptianEnglishEstonianEthiopianEuropeanFijianFilipinoFinnishFrenchFrench American IndianFrench CanadianGermanGerman RussianGhanaianGreekGuamanian/ChamorroGuatemalanGuyaneseHaitianHmongHonduranHopiHoumaHungarianIcelanderIndian (Asian)IndonesianInupiatIranianIraqiIrishIroquoisIsraeliItalianJamaicanJapaneseJordanianKenyanKiowaKoreanLaotianLatvianLebaneseLiberianLithuanianLumbeeLuxembourgerMacedonianMalaysianMalteseMarshalleseMenomineeMexicanMexican American IndianMongolianMoroccanNative HawaiianNavajoNepaleseNew ZealanderNicaraguanNigerianNorthern EuropeanNorwegianOkinawanOsageOttawaPaiutePakistaniPalestinianPanamanianParaguayanPennsylvania GermanPeruvianPimaPolishPortuguesePotawatomiPuebloPuerto RicanPuget Sound SalishRomanianRussianSalvadoranSamoanScandinavianScotch-IrishScottishSeminoleSenegaleseSerbianShoshoneSierra LeoneanSiouxSlavicSlovakSloveneSomaliSouth AfricanSouth AmericanSouth American IndianSoviet UnionSpaniardSpanishSpanish AmericanSpanish American IndianSri LankanSubsaharan AfricanSudaneseSwedishSwissSyrianTaiwaneseThaiTlingit-HaidaTohono O'OdhamTonganTrinidadian and TobagonianTsimshianTurkishU.S. Virgin IslanderUgandanUkrainianUruguayanUteVenezuelanVietnameseWelshWest IndianYakamaYaquiYugoslavianYumanYup'ikZimbabwean
Immigration
NonimmigrantsImmigrantsAfghanistanAfricaAlbaniaArgentinaArmeniaAsiaAustraliaAustriaBahamasBangladeshBarbadosBelarusBelgiumBelizeBoliviaBosnia and HerzegovinaBrazilBulgariaBurma/MyanmarCabo VerdeCambodiaCameroonCanadaCaribbeanCentral AmericaChileChinaColombiaCongoCosta RicaCroatiaCubaCzechoslovakiaDenmarkDominicaDominican RepublicEastern AfricaEastern AsiaEastern EuropeEcuadorEgyptEl SalvadorEnglandEritreaEthiopiaEuropeFijiFranceGermanyGhanaGreeceGrenadaGuatemalaGuyanaHaitiHondurasHong KongHungaryIndiaIndonesiaIranIraqIrelandIsraelItalyJamaicaJapanJordanKazakhstanKenyaKoreaKuwaitLaosLatin AmericaLatviaLebanonLiberiaLithuaniaMalaysiaMexicoMicronesiaMiddle AfricaMoldovaMoroccoNepalNetherlandsNicaraguaNigeriaNorth AmericaNorth MacedoniaNorthern AfricaNorthern EuropeNorwayOceaniaPakistanPanamaPeruPhilippinesPolandPortugalRomaniaRussiaSaudi ArabiaScotlandSenegalSerbiaSierra LeoneSingaporeSomaliaSouth AfricaSouth AmericaSouth Central AsiaSouth Eastern AsiaSouthern EuropeSpainSri LankaSt. Vincent and the GrenadinesSudanSwedenSwitzerlandSyriaTaiwanThailandTrinidad and TobagoTurkeyUgandaUkraineUruguayUzbekistanVenezuelaVietnamWest IndiesWestern AfricaWestern AsiaWestern EuropeYemenZaireZimbabweAzores
Cape Verdean
Race
Ancestry
AfghanAfricanAlaska NativeAlaskan AthabascanAlbanianAleutAlsatianAmericanApacheArabArapahoArgentineanArmenianAssyrian/Chaldean/SyriacAustralianAustrianBahamianBangladeshiBarbadianBasqueBelgianBelizeanBermudanBhutaneseBlackfeetBolivianBrazilianBritishBritish West IndianBulgarianBurmeseCajunCambodianCanadianCape VerdeanCarpatho RusynCelticCentral AmericanCentral American IndianCherokeeCheyenneChickasawChileanChineseChippewaChoctawColombianColvilleComancheCosta RicanCreeCreekCroatianCrowCubanCypriotCzechCzechoslovakianDanishDelawareDominicanDutchDutch West IndianEastern EuropeanEcuadorianEgyptianEnglishEstonianEthiopianEuropeanFijianFilipinoFinnishFrenchFrench American IndianFrench CanadianGermanGerman RussianGhanaianGreekGuamanian/ChamorroGuatemalanGuyaneseHaitianHmongHonduranHopiHoumaHungarianIcelanderIndian (Asian)IndonesianInupiatIranianIraqiIrishIroquoisIsraeliItalianJamaicanJapaneseJordanianKenyanKiowaKoreanLaotianLatvianLebaneseLiberianLithuanianLumbeeLuxembourgerMacedonianMalaysianMalteseMarshalleseMenomineeMexicanMexican American IndianMongolianMoroccanNative HawaiianNavajoNepaleseNew ZealanderNicaraguanNigerianNorthern EuropeanNorwegianOkinawanOsageOttawaPaiutePakistaniPalestinianPanamanianParaguayanPennsylvania GermanPeruvianPimaPolishPortuguesePotawatomiPuebloPuerto RicanPuget Sound SalishRomanianRussianSalvadoranSamoanScandinavianScotch-IrishScottishSeminoleSenegaleseSerbianShoshoneSierra LeoneanSiouxSlavicSlovakSloveneSomaliSouth AfricanSouth AmericanSouth American IndianSoviet UnionSpaniardSpanishSpanish AmericanSpanish American IndianSri LankanSubsaharan AfricanSudaneseSwedishSwissTaiwaneseThaiTlingit-HaidaTohono O'OdhamTonganTrinidadian and TobagonianTsimshianTurkishU.S. Virgin IslanderUgandanUkrainianUruguayanUteVenezuelanVietnameseWelshWest IndianYakamaYaquiYugoslavianYumanYup'ikZimbabwean
Immigration
NonimmigrantsImmigrantsAfghanistanAfricaAlbaniaArgentinaArmeniaAsiaAustraliaAustriaBahamasBangladeshBarbadosBelarusBelgiumBelizeBoliviaBosnia and HerzegovinaBrazilBulgariaBurma/MyanmarCabo VerdeCambodiaCameroonCanadaCaribbeanCentral AmericaChileChinaColombiaCongoCosta RicaCroatiaCubaCzechoslovakiaDenmarkDominicaDominican RepublicEastern AfricaEastern AsiaEastern EuropeEcuadorEgyptEl SalvadorEnglandEritreaEthiopiaEuropeFijiFranceGermanyGhanaGreeceGrenadaGuatemalaGuyanaHaitiHondurasHong KongHungaryIndiaIndonesiaIranIraqIrelandIsraelItalyJamaicaJapanJordanKazakhstanKenyaKoreaKuwaitLaosLatin AmericaLatviaLebanonLiberiaLithuaniaMalaysiaMexicoMicronesiaMiddle AfricaMoldovaMoroccoNepalNetherlandsNicaraguaNigeriaNorth AmericaNorth MacedoniaNorthern AfricaNorthern EuropeNorwayOceaniaPakistanPanamaPeruPhilippinesPolandPortugalRomaniaRussiaSaudi ArabiaScotlandSenegalSerbiaSierra LeoneSingaporeSomaliaSouth AfricaSouth AmericaSouth Central AsiaSouth Eastern AsiaSouthern EuropeSpainSri LankaSt. Vincent and the GrenadinesSudanSwedenSwitzerlandSyriaTaiwanThailandTrinidad and TobagoTurkeyUgandaUkraineUruguayUzbekistanVenezuelaVietnamWest IndiesWestern AfricaWestern AsiaWestern EuropeYemenZaireZimbabweAzores
11th Grade
Income
Poverty
Unemployment
Labor Participation
Family Structure
Vehicle Availability
Education Level
Disability

11th Grade Comparison

Syrians

Cape Verdeans

Exceptional
Tragic
93.4%
11TH GRADE
98.4/ 100
METRIC RATING
110th/ 347
METRIC RANK
89.1%
11TH GRADE
0.0/ 100
METRIC RATING
314th/ 347
METRIC RANK

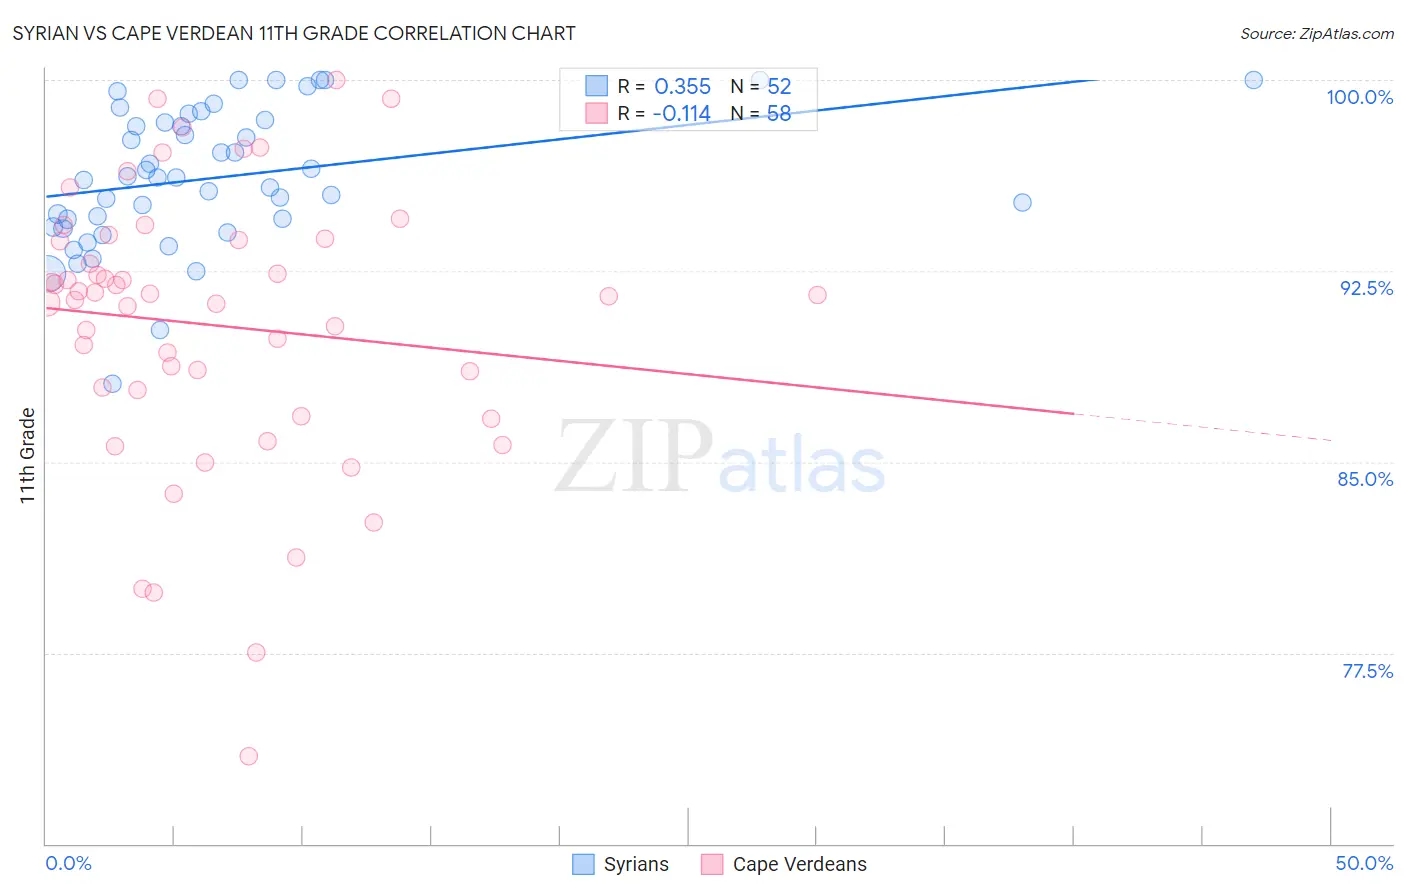
Syrian vs Cape Verdean 11th Grade Correlation Chart

The statistical analysis conducted on geographies consisting of 266,305,988 people shows a mild positive correlation between the proportion of Syrians and percentage of population with at least 11th grade education in the United States with a correlation coefficient (R) of 0.355 and weighted average of 93.4%. Similarly, the statistical analysis conducted on geographies consisting of 107,537,955 people shows a poor negative correlation between the proportion of Cape Verdeans and percentage of population with at least 11th grade education in the United States with a correlation coefficient (R) of -0.114 and weighted average of 89.1%, a difference of 4.9%.
Syrian vs Cape Verdean 11th Grade

11th Grade Correlation Summary

MeasurementSyrianCape Verdean
Minimum88.1%73.5%
Maximum100.0%100.0%
Range11.9%26.5%
Mean96.2%90.4%
Median96.2%91.5%
Interquartile 25% (IQ1)94.4%87.8%
Interquartile 75% (IQ3)98.4%93.7%
Interquartile Range (IQR)4.0%5.9%
Standard Deviation (Sample)2.7%5.4%
Standard Deviation (Population)2.7%5.4%

Similar Demographics by 11th Grade

Demographics Similar to Syrians by 11th Grade

In terms of 11th grade, the demographic groups most similar to Syrians are Immigrants from Norway (93.5%, a difference of 0.010%), Alaska Native (93.5%, a difference of 0.010%), Immigrants from Kuwait (93.5%, a difference of 0.010%), Lebanese (93.5%, a difference of 0.040%), and Immigrants from Europe (93.5%, a difference of 0.040%).
DemographicsRating | Rank11th Grade
Lebanese
98.6
/100
|
#103
Exceptional
93.5%
Immigrants | Europe
98.6
/100
|
#104
Exceptional
93.5%
Immigrants | Serbia
98.6
/100
|
#105
Exceptional
93.5%
Immigrants | Croatia
98.6
/100
|
#106
Exceptional
93.5%
Immigrants | Norway
98.4
/100
|
#107
Exceptional
93.5%
Alaska Natives
98.4
/100
|
#108
Exceptional
93.5%
Immigrants | Kuwait
98.4
/100
|
#109
Exceptional
93.5%
Syrians
98.4
/100
|
#110
Exceptional
93.4%
Yugoslavians
98.1
/100
|
#111
Exceptional
93.4%
Immigrants | Germany
98.0
/100
|
#112
Exceptional
93.4%
Immigrants | Zimbabwe
97.8
/100
|
#113
Exceptional
93.4%
Jordanians
97.8
/100
|
#114
Exceptional
93.4%
Palestinians
97.7
/100
|
#115
Exceptional
93.4%
Immigrants | Hungary
97.5
/100
|
#116
Exceptional
93.4%
Whites/Caucasians
97.4
/100
|
#117
Exceptional
93.3%

Demographics Similar to Cape Verdeans by 11th Grade

In terms of 11th grade, the demographic groups most similar to Cape Verdeans are Immigrants from Ecuador (89.1%, a difference of 0.010%), Immigrants from Caribbean (89.1%, a difference of 0.020%), Immigrants from Cuba (88.9%, a difference of 0.16%), Lumbee (88.9%, a difference of 0.17%), and Immigrants from Portugal (89.3%, a difference of 0.22%).
DemographicsRating | Rank11th Grade
Immigrants | Dominica
0.0
/100
|
#307
Tragic
89.5%
Nepalese
0.0
/100
|
#308
Tragic
89.5%
Immigrants | Bangladesh
0.0
/100
|
#309
Tragic
89.5%
Yaqui
0.0
/100
|
#310
Tragic
89.5%
Vietnamese
0.0
/100
|
#311
Tragic
89.4%
Immigrants | Portugal
0.0
/100
|
#312
Tragic
89.3%
Immigrants | Caribbean
0.0
/100
|
#313
Tragic
89.1%
Cape Verdeans
0.0
/100
|
#314
Tragic
89.1%
Immigrants | Ecuador
0.0
/100
|
#315
Tragic
89.1%
Immigrants | Cuba
0.0
/100
|
#316
Tragic
88.9%
Lumbee
0.0
/100
|
#317
Tragic
88.9%
Nicaraguans
0.0
/100
|
#318
Tragic
88.9%
Belizeans
0.0
/100
|
#319
Tragic
88.8%
Immigrants | Armenia
0.0
/100
|
#320
Tragic
88.8%
Immigrants | Belize
0.0
/100
|
#321
Tragic
88.7%