Pima vs Hispanic or Latino GED/Equivalency
COMPARE
Pima
Hispanic or Latino
GED/Equivalency
GED/Equivalency Comparison
Pima
Hispanics or Latinos
76.4%
GED/EQUIVALENCY
0.0/ 100
METRIC RATING
342nd/ 347
METRIC RANK
79.1%
GED/EQUIVALENCY
0.0/ 100
METRIC RATING
328th/ 347
METRIC RANK
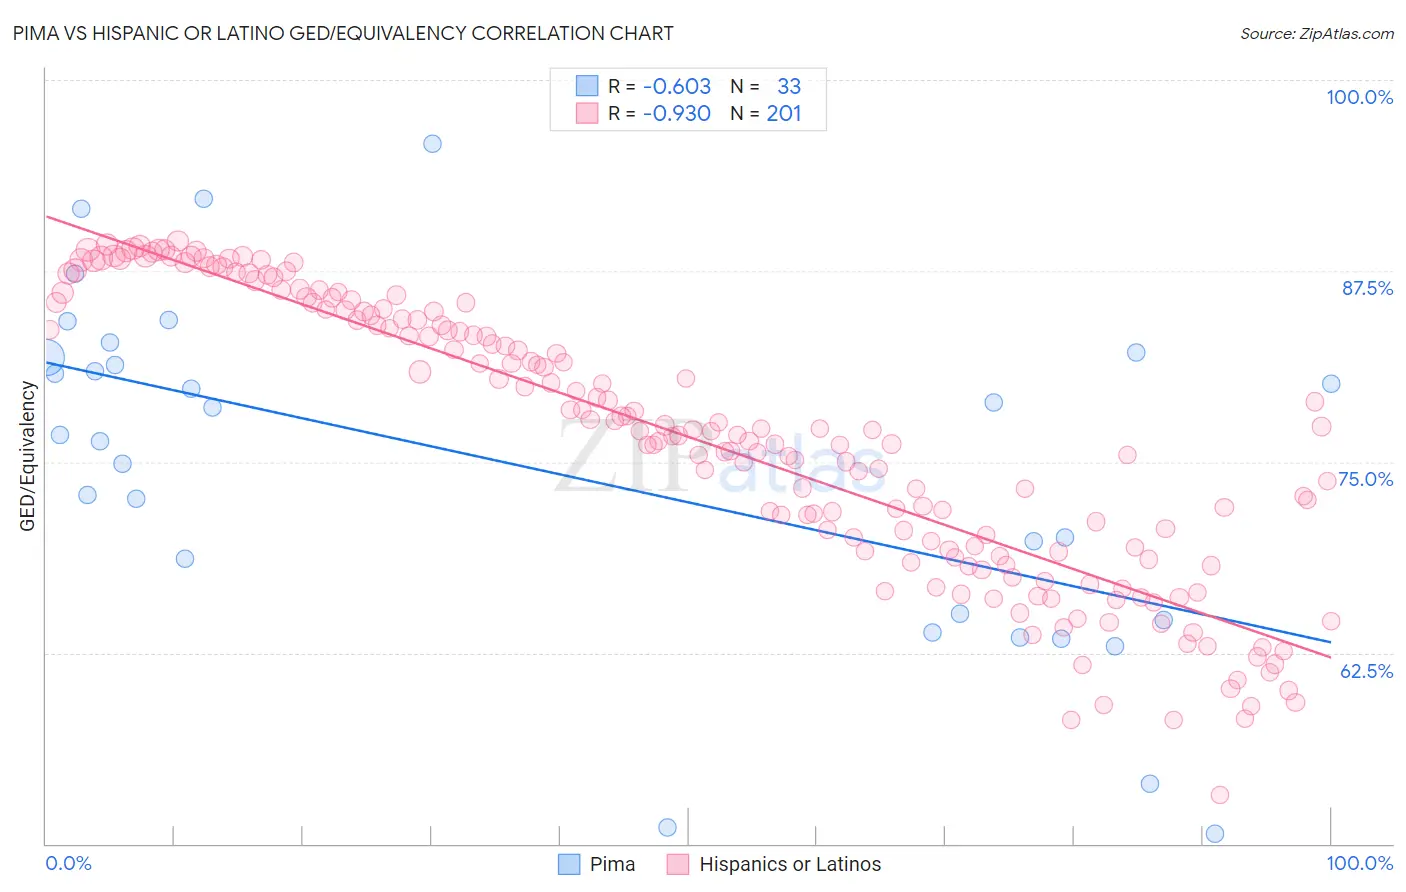
Pima vs Hispanic or Latino GED/Equivalency Correlation Chart
The statistical analysis conducted on geographies consisting of 61,552,828 people shows a significant negative correlation between the proportion of Pima and percentage of population with at least ged/equivalency education in the United States with a correlation coefficient (R) of -0.603 and weighted average of 76.4%. Similarly, the statistical analysis conducted on geographies consisting of 578,611,870 people shows a near-perfect negative correlation between the proportion of Hispanics or Latinos and percentage of population with at least ged/equivalency education in the United States with a correlation coefficient (R) of -0.930 and weighted average of 79.1%, a difference of 3.5%.
GED/Equivalency Correlation Summary
| Measurement | Pima | Hispanic or Latino |
| Minimum | 50.7% | 53.2% |
| Maximum | 95.8% | 89.5% |
| Range | 45.2% | 36.2% |
| Mean | 74.7% | 76.6% |
| Median | 76.8% | 77.1% |
| Interquartile 25% (IQ1) | 64.8% | 69.1% |
| Interquartile 75% (IQ3) | 82.0% | 84.9% |
| Interquartile Range (IQR) | 17.2% | 15.7% |
| Standard Deviation (Sample) | 11.4% | 9.0% |
| Standard Deviation (Population) | 11.2% | 9.0% |
Demographics Similar to Pima and Hispanics or Latinos by GED/Equivalency
In terms of ged/equivalency, the demographic groups most similar to Pima are Immigrants from Central America (76.4%, a difference of 0.090%), Spanish American Indian (76.3%, a difference of 0.12%), Immigrants from Mexico (75.7%, a difference of 1.0%), Mexican (77.4%, a difference of 1.3%), and Tohono O'odham (77.5%, a difference of 1.4%). Similarly, the demographic groups most similar to Hispanics or Latinos are Dominican (79.1%, a difference of 0.050%), Central American (79.2%, a difference of 0.10%), Yuman (79.2%, a difference of 0.13%), Immigrants from Cabo Verde (78.9%, a difference of 0.20%), and Honduran (79.3%, a difference of 0.22%).
| Demographics | Rating | Rank | GED/Equivalency |
| Hondurans | 0.0 /100 | #325 | Tragic 79.3% |
| Yuman | 0.0 /100 | #326 | Tragic 79.2% |
| Central Americans | 0.0 /100 | #327 | Tragic 79.2% |
| Hispanics or Latinos | 0.0 /100 | #328 | Tragic 79.1% |
| Dominicans | 0.0 /100 | #329 | Tragic 79.1% |
| Immigrants | Cabo Verde | 0.0 /100 | #330 | Tragic 78.9% |
| Immigrants | Honduras | 0.0 /100 | #331 | Tragic 78.7% |
| Immigrants | Azores | 0.0 /100 | #332 | Tragic 78.7% |
| Salvadorans | 0.0 /100 | #333 | Tragic 78.6% |
| Guatemalans | 0.0 /100 | #334 | Tragic 78.5% |
| Immigrants | Latin America | 0.0 /100 | #335 | Tragic 78.5% |
| Immigrants | Dominican Republic | 0.0 /100 | #336 | Tragic 78.0% |
| Immigrants | Yemen | 0.0 /100 | #337 | Tragic 77.9% |
| Immigrants | Guatemala | 0.0 /100 | #338 | Tragic 77.9% |
| Immigrants | El Salvador | 0.0 /100 | #339 | Tragic 77.6% |
| Tohono O'odham | 0.0 /100 | #340 | Tragic 77.5% |
| Mexicans | 0.0 /100 | #341 | Tragic 77.4% |
| Pima | 0.0 /100 | #342 | Tragic 76.4% |
| Immigrants | Central America | 0.0 /100 | #343 | Tragic 76.4% |
| Spanish American Indians | 0.0 /100 | #344 | Tragic 76.3% |
| Immigrants | Mexico | 0.0 /100 | #345 | Tragic 75.7% |