Liberian vs Somali 11th Grade

COMPARE

Liberian
Race
Ancestry
AfghanAfricanAlaska NativeAlaskan AthabascanAlbanianAleutAlsatianAmericanApacheArabArapahoArgentineanArmenianAssyrian/Chaldean/SyriacAustralianAustrianBahamianBangladeshiBarbadianBasqueBelgianBelizeanBermudanBhutaneseBlackfeetBolivianBrazilianBritishBritish West IndianBulgarianBurmeseCajunCambodianCanadianCape VerdeanCarpatho RusynCelticCentral AmericanCentral American IndianCherokeeCheyenneChickasawChileanChineseChippewaChoctawColombianColvilleComancheCosta RicanCreeCreekCroatianCrowCubanCypriotCzechCzechoslovakianDanishDelawareDominicanDutchDutch West IndianEastern EuropeanEcuadorianEgyptianEnglishEstonianEthiopianEuropeanFijianFilipinoFinnishFrenchFrench American IndianFrench CanadianGermanGerman RussianGhanaianGreekGuamanian/ChamorroGuatemalanGuyaneseHaitianHmongHonduranHopiHoumaHungarianIcelanderIndian (Asian)IndonesianInupiatIranianIraqiIrishIroquoisIsraeliItalianJamaicanJapaneseJordanianKenyanKiowaKoreanLaotianLatvianLebaneseLiberianLithuanianLumbeeLuxembourgerMacedonianMalaysianMalteseMarshalleseMenomineeMexicanMexican American IndianMongolianMoroccanNative HawaiianNavajoNepaleseNew ZealanderNicaraguanNigerianNorthern EuropeanNorwegianOkinawanOsageOttawaPaiutePakistaniPalestinianPanamanianParaguayanPennsylvania GermanPeruvianPimaPolishPortuguesePotawatomiPuebloPuerto RicanPuget Sound SalishRomanianRussianSalvadoranSamoanScandinavianScotch-IrishScottishSeminoleSenegaleseSerbianShoshoneSierra LeoneanSiouxSlavicSlovakSloveneSouth AfricanSouth AmericanSouth American IndianSoviet UnionSpaniardSpanishSpanish AmericanSpanish American IndianSri LankanSubsaharan AfricanSudaneseSwedishSwissSyrianTaiwaneseThaiTlingit-HaidaTohono O'OdhamTonganTrinidadian and TobagonianTsimshianTurkishU.S. Virgin IslanderUgandanUkrainianUruguayanUteVenezuelanVietnameseWelshWest IndianYakamaYaquiYugoslavianYumanYup'ikZimbabwean
Immigration
NonimmigrantsImmigrantsAfghanistanAfricaAlbaniaArgentinaArmeniaAsiaAustraliaAustriaBahamasBangladeshBarbadosBelarusBelgiumBelizeBoliviaBosnia and HerzegovinaBrazilBulgariaBurma/MyanmarCabo VerdeCambodiaCameroonCanadaCaribbeanCentral AmericaChileChinaColombiaCongoCosta RicaCroatiaCubaCzechoslovakiaDenmarkDominicaDominican RepublicEastern AfricaEastern AsiaEastern EuropeEcuadorEgyptEl SalvadorEnglandEritreaEthiopiaEuropeFijiFranceGermanyGhanaGreeceGrenadaGuatemalaGuyanaHaitiHondurasHong KongHungaryIndiaIndonesiaIranIraqIrelandIsraelItalyJamaicaJapanJordanKazakhstanKenyaKoreaKuwaitLaosLatin AmericaLatviaLebanonLiberiaLithuaniaMalaysiaMexicoMicronesiaMiddle AfricaMoldovaMoroccoNepalNetherlandsNicaraguaNigeriaNorth AmericaNorth MacedoniaNorthern AfricaNorthern EuropeNorwayOceaniaPakistanPanamaPeruPhilippinesPolandPortugalRomaniaRussiaSaudi ArabiaScotlandSenegalSerbiaSierra LeoneSingaporeSomaliaSouth AfricaSouth AmericaSouth Central AsiaSouth Eastern AsiaSouthern EuropeSpainSri LankaSt. Vincent and the GrenadinesSudanSwedenSwitzerlandSyriaTaiwanThailandTrinidad and TobagoTurkeyUgandaUkraineUruguayUzbekistanVenezuelaVietnamWest IndiesWestern AfricaWestern AsiaWestern EuropeYemenZaireZimbabweAzores
Somali
Race
Ancestry
AfghanAfricanAlaska NativeAlaskan AthabascanAlbanianAleutAlsatianAmericanApacheArabArapahoArgentineanArmenianAssyrian/Chaldean/SyriacAustralianAustrianBahamianBangladeshiBarbadianBasqueBelgianBelizeanBermudanBhutaneseBlackfeetBolivianBrazilianBritishBritish West IndianBulgarianBurmeseCajunCambodianCanadianCape VerdeanCarpatho RusynCelticCentral AmericanCentral American IndianCherokeeCheyenneChickasawChileanChineseChippewaChoctawColombianColvilleComancheCosta RicanCreeCreekCroatianCrowCubanCypriotCzechCzechoslovakianDanishDelawareDominicanDutchDutch West IndianEastern EuropeanEcuadorianEgyptianEnglishEstonianEthiopianEuropeanFijianFilipinoFinnishFrenchFrench American IndianFrench CanadianGermanGerman RussianGhanaianGreekGuamanian/ChamorroGuatemalanGuyaneseHaitianHmongHonduranHopiHoumaHungarianIcelanderIndian (Asian)IndonesianInupiatIranianIraqiIrishIroquoisIsraeliItalianJamaicanJapaneseJordanianKenyanKiowaKoreanLaotianLatvianLebaneseLithuanianLumbeeLuxembourgerMacedonianMalaysianMalteseMarshalleseMenomineeMexicanMexican American IndianMongolianMoroccanNative HawaiianNavajoNepaleseNew ZealanderNicaraguanNigerianNorthern EuropeanNorwegianOkinawanOsageOttawaPaiutePakistaniPalestinianPanamanianParaguayanPennsylvania GermanPeruvianPimaPolishPortuguesePotawatomiPuebloPuerto RicanPuget Sound SalishRomanianRussianSalvadoranSamoanScandinavianScotch-IrishScottishSeminoleSenegaleseSerbianShoshoneSierra LeoneanSiouxSlavicSlovakSloveneSomaliSouth AfricanSouth AmericanSouth American IndianSoviet UnionSpaniardSpanishSpanish AmericanSpanish American IndianSri LankanSubsaharan AfricanSudaneseSwedishSwissSyrianTaiwaneseThaiTlingit-HaidaTohono O'OdhamTonganTrinidadian and TobagonianTsimshianTurkishU.S. Virgin IslanderUgandanUkrainianUruguayanUteVenezuelanVietnameseWelshWest IndianYakamaYaquiYugoslavianYumanYup'ikZimbabwean
Immigration
NonimmigrantsImmigrantsAfghanistanAfricaAlbaniaArgentinaArmeniaAsiaAustraliaAustriaBahamasBangladeshBarbadosBelarusBelgiumBelizeBoliviaBosnia and HerzegovinaBrazilBulgariaBurma/MyanmarCabo VerdeCambodiaCameroonCanadaCaribbeanCentral AmericaChileChinaColombiaCongoCosta RicaCroatiaCubaCzechoslovakiaDenmarkDominicaDominican RepublicEastern AfricaEastern AsiaEastern EuropeEcuadorEgyptEl SalvadorEnglandEritreaEthiopiaEuropeFijiFranceGermanyGhanaGreeceGrenadaGuatemalaGuyanaHaitiHondurasHong KongHungaryIndiaIndonesiaIranIraqIrelandIsraelItalyJamaicaJapanJordanKazakhstanKenyaKoreaKuwaitLaosLatin AmericaLatviaLebanonLiberiaLithuaniaMalaysiaMexicoMicronesiaMiddle AfricaMoldovaMoroccoNepalNetherlandsNicaraguaNigeriaNorth AmericaNorth MacedoniaNorthern AfricaNorthern EuropeNorwayOceaniaPakistanPanamaPeruPhilippinesPolandPortugalRomaniaRussiaSaudi ArabiaScotlandSenegalSerbiaSierra LeoneSingaporeSomaliaSouth AfricaSouth AmericaSouth Central AsiaSouth Eastern AsiaSouthern EuropeSpainSri LankaSt. Vincent and the GrenadinesSudanSwedenSwitzerlandSyriaTaiwanThailandTrinidad and TobagoTurkeyUgandaUkraineUruguayUzbekistanVenezuelaVietnamWest IndiesWestern AfricaWestern AsiaWestern EuropeYemenZaireZimbabweAzores
11th Grade
Income
Poverty
Unemployment
Labor Participation
Family Structure
Vehicle Availability
Education Level
Disability

11th Grade Comparison

Liberians

Somalis

Fair
Poor
92.3%
11TH GRADE
26.8/ 100
METRIC RATING
195th/ 347
METRIC RANK
92.1%
11TH GRADE
11.6/ 100
METRIC RATING
216th/ 347
METRIC RANK

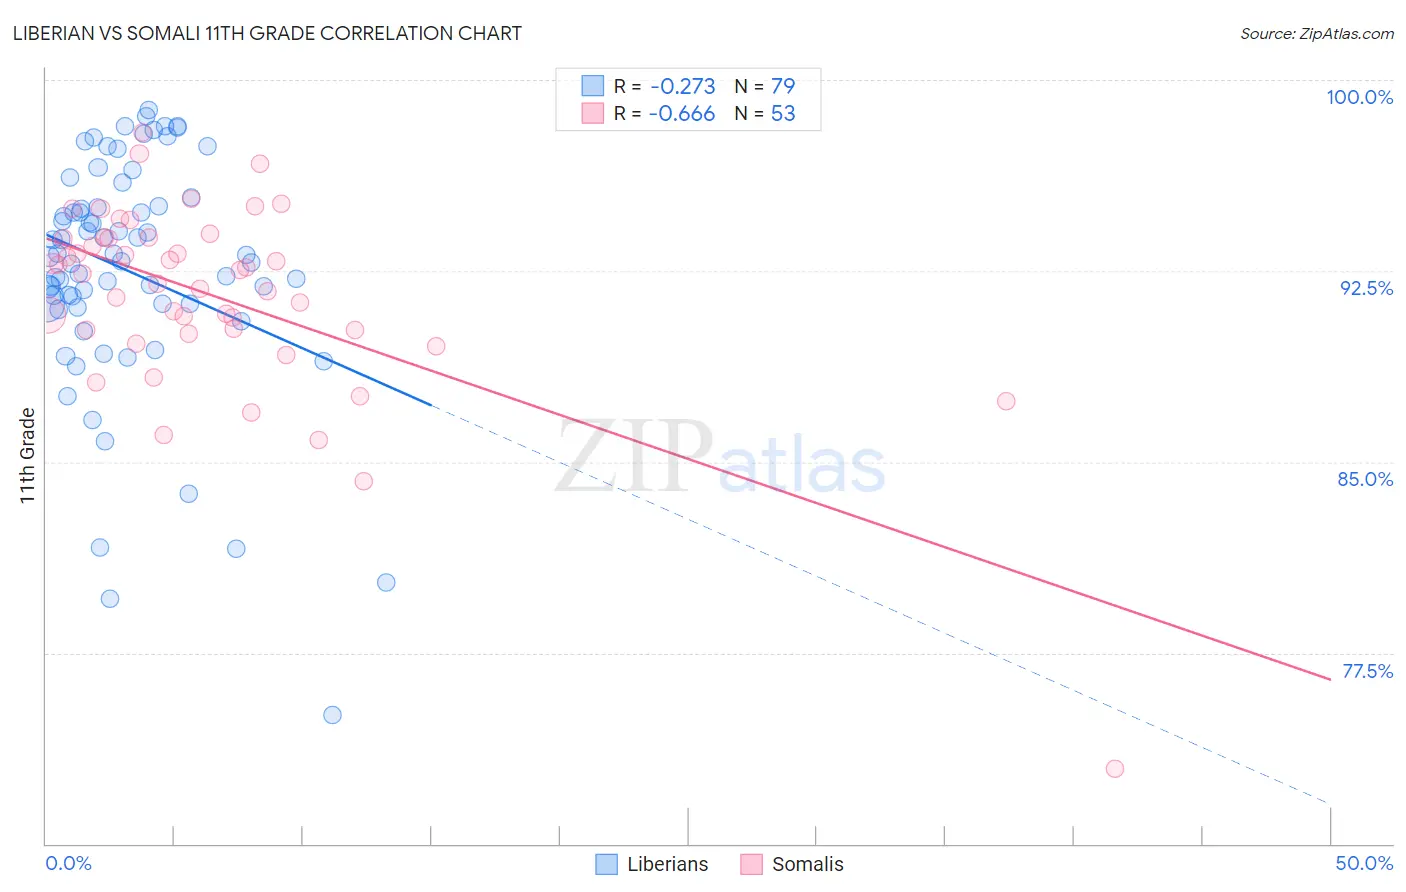
Liberian vs Somali 11th Grade Correlation Chart

The statistical analysis conducted on geographies consisting of 118,101,728 people shows a weak negative correlation between the proportion of Liberians and percentage of population with at least 11th grade education in the United States with a correlation coefficient (R) of -0.273 and weighted average of 92.3%. Similarly, the statistical analysis conducted on geographies consisting of 99,330,527 people shows a significant negative correlation between the proportion of Somalis and percentage of population with at least 11th grade education in the United States with a correlation coefficient (R) of -0.666 and weighted average of 92.1%, a difference of 0.25%.
Liberian vs Somali 11th Grade

11th Grade Correlation Summary

MeasurementLiberianSomali
Minimum75.1%72.9%
Maximum98.8%98.0%
Range23.7%25.0%
Mean92.5%91.5%
Median93.1%92.4%
Interquartile 25% (IQ1)91.2%90.1%
Interquartile 75% (IQ3)95.1%93.8%
Interquartile Range (IQR)3.8%3.7%
Standard Deviation (Sample)4.6%3.9%
Standard Deviation (Population)4.6%3.9%

Similar Demographics by 11th Grade

Demographics Similar to Liberians by 11th Grade

In terms of 11th grade, the demographic groups most similar to Liberians are Panamanian (92.3%, a difference of 0.010%), Marshallese (92.3%, a difference of 0.010%), Moroccan (92.3%, a difference of 0.020%), Sioux (92.3%, a difference of 0.020%), and Hawaiian (92.3%, a difference of 0.020%).
DemographicsRating | Rank11th Grade
Immigrants | Indonesia
33.7
/100
|
#188
Fair
92.4%
Immigrants | Chile
33.3
/100
|
#189
Fair
92.4%
Chickasaw
31.4
/100
|
#190
Fair
92.3%
French American Indians
30.8
/100
|
#191
Fair
92.3%
Immigrants | Syria
30.4
/100
|
#192
Fair
92.3%
Moroccans
28.7
/100
|
#193
Fair
92.3%
Sioux
28.5
/100
|
#194
Fair
92.3%
Liberians
26.8
/100
|
#195
Fair
92.3%
Panamanians
26.4
/100
|
#196
Fair
92.3%
Marshallese
26.0
/100
|
#197
Fair
92.3%
Hawaiians
25.5
/100
|
#198
Fair
92.3%
Immigrants | Uganda
25.2
/100
|
#199
Fair
92.3%
Samoans
25.1
/100
|
#200
Fair
92.3%
Immigrants | China
25.1
/100
|
#201
Fair
92.3%
Immigrants | Eastern Africa
24.1
/100
|
#202
Fair
92.3%

Demographics Similar to Somalis by 11th Grade

In terms of 11th grade, the demographic groups most similar to Somalis are Immigrants from Sierra Leone (92.0%, a difference of 0.010%), Immigrants from Southern Europe (92.1%, a difference of 0.020%), Afghan (92.1%, a difference of 0.030%), Blackfeet (92.0%, a difference of 0.040%), and Portuguese (92.0%, a difference of 0.040%).
DemographicsRating | Rank11th Grade
Tongans
19.8
/100
|
#209
Poor
92.2%
Ethiopians
18.8
/100
|
#210
Poor
92.2%
Immigrants | Micronesia
17.7
/100
|
#211
Poor
92.2%
Koreans
14.4
/100
|
#212
Poor
92.1%
Immigrants | Ethiopia
13.9
/100
|
#213
Poor
92.1%
Afghans
12.8
/100
|
#214
Poor
92.1%
Immigrants | Southern Europe
12.5
/100
|
#215
Poor
92.1%
Somalis
11.6
/100
|
#216
Poor
92.1%
Immigrants | Sierra Leone
11.1
/100
|
#217
Poor
92.0%
Blackfeet
10.1
/100
|
#218
Poor
92.0%
Portuguese
10.0
/100
|
#219
Tragic
92.0%
South American Indians
7.6
/100
|
#220
Tragic
92.0%
Immigrants | Liberia
7.0
/100
|
#221
Tragic
91.9%
Immigrants | Africa
6.5
/100
|
#222
Tragic
91.9%
Immigrants | Bahamas
6.5
/100
|
#223
Tragic
91.9%