Liberian vs Immigrants from Mexico 11th Grade
COMPARE
Liberian
Immigrants from Mexico
11th Grade
11th Grade Comparison
Liberians
Immigrants from Mexico
92.3%
11TH GRADE
26.8/ 100
METRIC RATING
195th/ 347
METRIC RANK
84.5%
11TH GRADE
0.0/ 100
METRIC RATING
347th/ 347
METRIC RANK
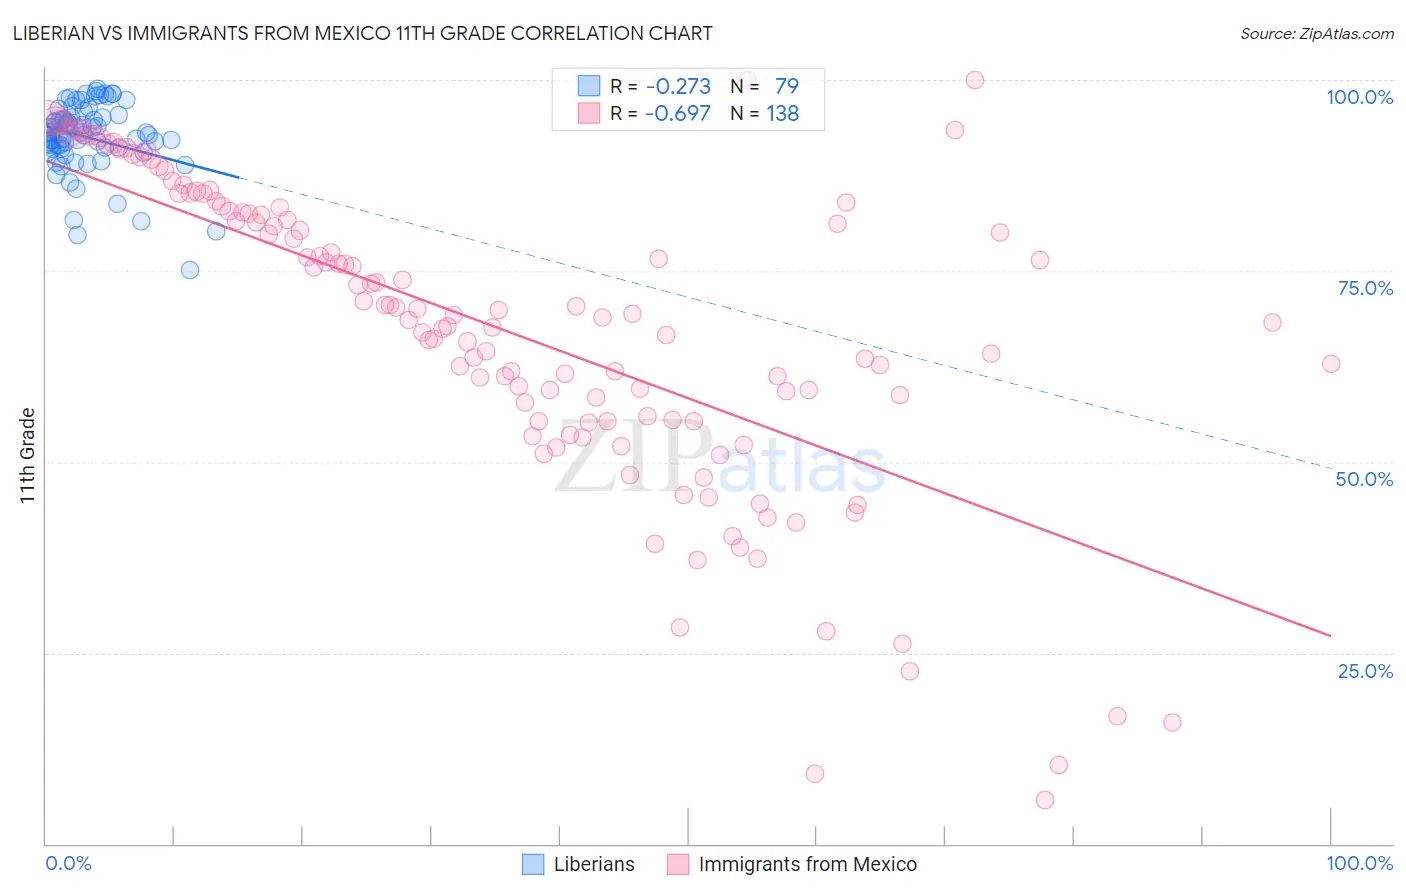
Liberian vs Immigrants from Mexico 11th Grade Correlation Chart
The statistical analysis conducted on geographies consisting of 118,101,728 people shows a weak negative correlation between the proportion of Liberians and percentage of population with at least 11th grade education in the United States with a correlation coefficient (R) of -0.273 and weighted average of 92.3%. Similarly, the statistical analysis conducted on geographies consisting of 513,766,645 people shows a significant negative correlation between the proportion of Immigrants from Mexico and percentage of population with at least 11th grade education in the United States with a correlation coefficient (R) of -0.697 and weighted average of 84.5%, a difference of 9.2%.
11th Grade Correlation Summary
| Measurement | Liberian | Immigrants from Mexico |
| Minimum | 75.1% | 5.7% |
| Maximum | 98.8% | 100.0% |
| Range | 23.7% | 94.3% |
| Mean | 92.5% | 67.1% |
| Median | 93.1% | 69.1% |
| Interquartile 25% (IQ1) | 91.2% | 55.4% |
| Interquartile 75% (IQ3) | 95.1% | 82.6% |
| Interquartile Range (IQR) | 3.8% | 27.3% |
| Standard Deviation (Sample) | 4.6% | 20.2% |
| Standard Deviation (Population) | 4.6% | 20.1% |
Similar Demographics by 11th Grade
Demographics Similar to Liberians by 11th Grade
In terms of 11th grade, the demographic groups most similar to Liberians are Panamanian (92.3%, a difference of 0.010%), Marshallese (92.3%, a difference of 0.010%), Moroccan (92.3%, a difference of 0.020%), Sioux (92.3%, a difference of 0.020%), and Hawaiian (92.3%, a difference of 0.020%).
| Demographics | Rating | Rank | 11th Grade |
| Immigrants | Indonesia | 33.7 /100 | #188 | Fair 92.4% |
| Immigrants | Chile | 33.3 /100 | #189 | Fair 92.4% |
| Chickasaw | 31.4 /100 | #190 | Fair 92.3% |
| French American Indians | 30.8 /100 | #191 | Fair 92.3% |
| Immigrants | Syria | 30.4 /100 | #192 | Fair 92.3% |
| Moroccans | 28.7 /100 | #193 | Fair 92.3% |
| Sioux | 28.5 /100 | #194 | Fair 92.3% |
| Liberians | 26.8 /100 | #195 | Fair 92.3% |
| Panamanians | 26.4 /100 | #196 | Fair 92.3% |
| Marshallese | 26.0 /100 | #197 | Fair 92.3% |
| Hawaiians | 25.5 /100 | #198 | Fair 92.3% |
| Immigrants | Uganda | 25.2 /100 | #199 | Fair 92.3% |
| Samoans | 25.1 /100 | #200 | Fair 92.3% |
| Immigrants | China | 25.1 /100 | #201 | Fair 92.3% |
| Immigrants | Eastern Africa | 24.1 /100 | #202 | Fair 92.3% |
Demographics Similar to Immigrants from Mexico by 11th Grade
In terms of 11th grade, the demographic groups most similar to Immigrants from Mexico are Spanish American Indian (84.7%, a difference of 0.30%), Immigrants from Central America (84.9%, a difference of 0.54%), Yakama (85.0%, a difference of 0.57%), Immigrants from El Salvador (85.3%, a difference of 0.98%), and Immigrants from Guatemala (85.8%, a difference of 1.6%).
| Demographics | Rating | Rank | 11th Grade |
| Immigrants | Yemen | 0.0 /100 | #333 | Tragic 87.1% |
| Houma | 0.0 /100 | #334 | Tragic 87.0% |
| Central Americans | 0.0 /100 | #335 | Tragic 86.9% |
| Immigrants | Dominican Republic | 0.0 /100 | #336 | Tragic 86.9% |
| Immigrants | Honduras | 0.0 /100 | #337 | Tragic 86.9% |
| Immigrants | Latin America | 0.0 /100 | #338 | Tragic 86.8% |
| Guatemalans | 0.0 /100 | #339 | Tragic 86.4% |
| Salvadorans | 0.0 /100 | #340 | Tragic 86.2% |
| Mexicans | 0.0 /100 | #341 | Tragic 86.1% |
| Immigrants | Guatemala | 0.0 /100 | #342 | Tragic 85.8% |
| Immigrants | El Salvador | 0.0 /100 | #343 | Tragic 85.3% |
| Yakama | 0.0 /100 | #344 | Tragic 85.0% |
| Immigrants | Central America | 0.0 /100 | #345 | Tragic 84.9% |
| Spanish American Indians | 0.0 /100 | #346 | Tragic 84.7% |
| Immigrants | Mexico | 0.0 /100 | #347 | Tragic 84.5% |