Iroquois vs Tohono O'odham College, Under 1 year
COMPARE
Iroquois
Tohono O'odham
College, Under 1 year
College, Under 1 year Comparison
Iroquois
Tohono O'odham
62.6%
COLLEGE, UNDER 1 YEAR
2.0/ 100
METRIC RATING
233rd/ 347
METRIC RANK
52.8%
COLLEGE, UNDER 1 YEAR
0.0/ 100
METRIC RATING
343rd/ 347
METRIC RANK
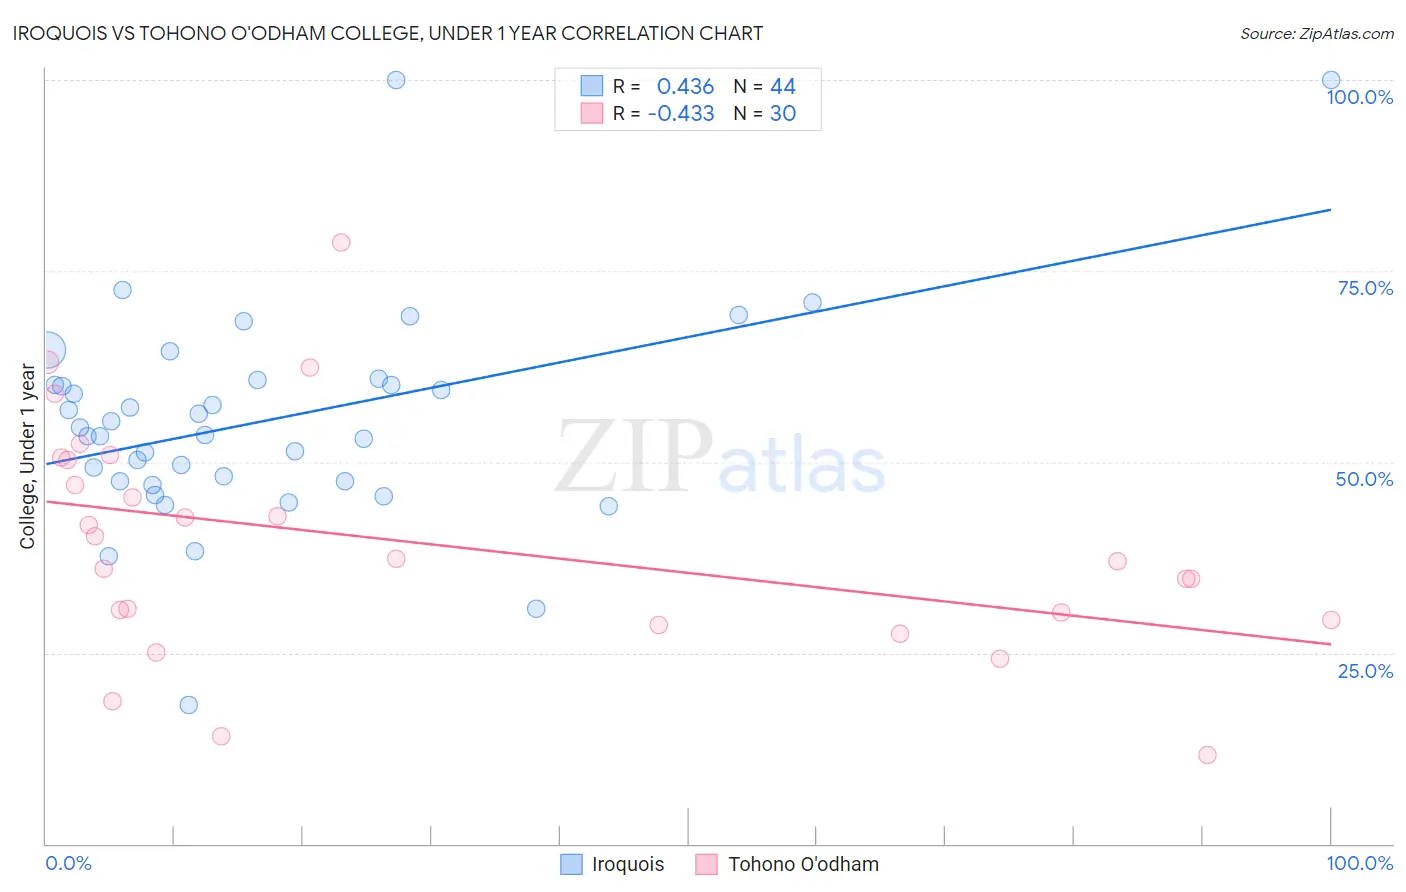
Iroquois vs Tohono O'odham College, Under 1 year Correlation Chart
The statistical analysis conducted on geographies consisting of 207,308,653 people shows a moderate positive correlation between the proportion of Iroquois and percentage of population with at least college, under 1 year education in the United States with a correlation coefficient (R) of 0.436 and weighted average of 62.6%. Similarly, the statistical analysis conducted on geographies consisting of 58,730,051 people shows a moderate negative correlation between the proportion of Tohono O'odham and percentage of population with at least college, under 1 year education in the United States with a correlation coefficient (R) of -0.433 and weighted average of 52.8%, a difference of 18.6%.
College, Under 1 year Correlation Summary
| Measurement | Iroquois | Tohono O'odham |
| Minimum | 18.2% | 11.6% |
| Maximum | 100.0% | 78.8% |
| Range | 81.8% | 67.2% |
| Mean | 55.5% | 39.3% |
| Median | 54.0% | 37.1% |
| Interquartile 25% (IQ1) | 47.4% | 29.3% |
| Interquartile 75% (IQ3) | 60.4% | 50.2% |
| Interquartile Range (IQR) | 13.0% | 20.9% |
| Standard Deviation (Sample) | 14.4% | 15.1% |
| Standard Deviation (Population) | 14.3% | 14.9% |
Similar Demographics by College, Under 1 year
Demographics Similar to Iroquois by College, Under 1 year
In terms of college, under 1 year, the demographic groups most similar to Iroquois are Chippewa (62.6%, a difference of 0.030%), Spanish American (62.6%, a difference of 0.080%), Osage (62.7%, a difference of 0.12%), Immigrants (62.5%, a difference of 0.21%), and Immigrants from Western Africa (62.8%, a difference of 0.22%).
| Demographics | Rating | Rank | College, Under 1 year |
| Immigrants | Colombia | 4.0 /100 | #226 | Tragic 63.1% |
| Immigrants | Ghana | 3.7 /100 | #227 | Tragic 63.1% |
| Samoans | 3.3 /100 | #228 | Tragic 63.0% |
| Liberians | 3.2 /100 | #229 | Tragic 63.0% |
| Immigrants | Nonimmigrants | 3.0 /100 | #230 | Tragic 62.9% |
| Immigrants | Western Africa | 2.4 /100 | #231 | Tragic 62.8% |
| Osage | 2.2 /100 | #232 | Tragic 62.7% |
| Iroquois | 2.0 /100 | #233 | Tragic 62.6% |
| Chippewa | 2.0 /100 | #234 | Tragic 62.6% |
| Spanish Americans | 1.9 /100 | #235 | Tragic 62.6% |
| Immigrants | Immigrants | 1.7 /100 | #236 | Tragic 62.5% |
| Immigrants | Burma/Myanmar | 1.6 /100 | #237 | Tragic 62.5% |
| French American Indians | 1.5 /100 | #238 | Tragic 62.4% |
| Nepalese | 1.1 /100 | #239 | Tragic 62.2% |
| Aleuts | 1.1 /100 | #240 | Tragic 62.2% |
Demographics Similar to Tohono O'odham by College, Under 1 year
In terms of college, under 1 year, the demographic groups most similar to Tohono O'odham are Yakama (52.6%, a difference of 0.30%), Immigrants from Mexico (53.7%, a difference of 1.6%), Immigrants from Cabo Verde (53.7%, a difference of 1.7%), Spanish American Indian (54.0%, a difference of 2.2%), and Immigrants from Dominican Republic (54.0%, a difference of 2.3%).
| Demographics | Rating | Rank | College, Under 1 year |
| Yuman | 0.0 /100 | #333 | Tragic 55.1% |
| Immigrants | Azores | 0.0 /100 | #334 | Tragic 54.7% |
| Inupiat | 0.0 /100 | #335 | Tragic 54.6% |
| Pennsylvania Germans | 0.0 /100 | #336 | Tragic 54.5% |
| Immigrants | Central America | 0.0 /100 | #337 | Tragic 54.4% |
| Lumbee | 0.0 /100 | #338 | Tragic 54.2% |
| Immigrants | Dominican Republic | 0.0 /100 | #339 | Tragic 54.0% |
| Spanish American Indians | 0.0 /100 | #340 | Tragic 54.0% |
| Immigrants | Cabo Verde | 0.0 /100 | #341 | Tragic 53.7% |
| Immigrants | Mexico | 0.0 /100 | #342 | Tragic 53.7% |
| Tohono O'odham | 0.0 /100 | #343 | Tragic 52.8% |
| Yakama | 0.0 /100 | #344 | Tragic 52.6% |
| Pima | 0.0 /100 | #345 | Tragic 51.4% |
| Houma | 0.0 /100 | #346 | Tragic 47.6% |
| Yup'ik | 0.0 /100 | #347 | Tragic 45.8% |