Immigrants from South Central Asia vs Latvian 6th Grade

COMPARE

Immigrants from South Central Asia
Race
Ancestry
AfghanAfricanAlaska NativeAlaskan AthabascanAlbanianAleutAlsatianAmericanApacheArabArapahoArgentineanArmenianAssyrian/Chaldean/SyriacAustralianAustrianBahamianBangladeshiBarbadianBasqueBelgianBelizeanBermudanBhutaneseBlackfeetBolivianBrazilianBritishBritish West IndianBulgarianBurmeseCajunCambodianCanadianCape VerdeanCarpatho RusynCelticCentral AmericanCentral American IndianCherokeeCheyenneChickasawChileanChineseChippewaChoctawColombianColvilleComancheCosta RicanCreeCreekCroatianCrowCubanCypriotCzechCzechoslovakianDanishDelawareDominicanDutchDutch West IndianEastern EuropeanEcuadorianEgyptianEnglishEstonianEthiopianEuropeanFijianFilipinoFinnishFrenchFrench American IndianFrench CanadianGermanGerman RussianGhanaianGreekGuamanian/ChamorroGuatemalanGuyaneseHaitianHmongHonduranHopiHoumaHungarianIcelanderIndian (Asian)IndonesianInupiatIranianIraqiIrishIroquoisIsraeliItalianJamaicanJapaneseJordanianKenyanKiowaKoreanLaotianLebaneseLiberianLithuanianLumbeeLuxembourgerMacedonianMalaysianMalteseMarshalleseMenomineeMexicanMexican American IndianMongolianMoroccanNative HawaiianNavajoNepaleseNew ZealanderNicaraguanNigerianNorthern EuropeanNorwegianOkinawanOsageOttawaPaiutePakistaniPalestinianPanamanianParaguayanPennsylvania GermanPeruvianPimaPolishPortuguesePotawatomiPuebloPuerto RicanPuget Sound SalishRomanianRussianSalvadoranSamoanScandinavianScotch-IrishScottishSeminoleSenegaleseSerbianShoshoneSierra LeoneanSiouxSlavicSlovakSloveneSomaliSouth AfricanSouth AmericanSouth American IndianSoviet UnionSpaniardSpanishSpanish AmericanSpanish American IndianSri LankanSubsaharan AfricanSudaneseSwedishSwissSyrianTaiwaneseThaiTlingit-HaidaTohono O'OdhamTonganTrinidadian and TobagonianTsimshianTurkishU.S. Virgin IslanderUgandanUkrainianUruguayanUteVenezuelanVietnameseWelshWest IndianYakamaYaquiYugoslavianYumanYup'ikZimbabwean
Immigration
NonimmigrantsImmigrantsAfghanistanAfricaAlbaniaArgentinaArmeniaAsiaAustraliaAustriaBahamasBangladeshBarbadosBelarusBelgiumBelizeBoliviaBosnia and HerzegovinaBrazilBulgariaBurma/MyanmarCabo VerdeCambodiaCameroonCanadaCaribbeanCentral AmericaChileChinaColombiaCongoCosta RicaCroatiaCubaCzechoslovakiaDenmarkDominicaDominican RepublicEastern AfricaEastern AsiaEastern EuropeEcuadorEgyptEl SalvadorEnglandEritreaEthiopiaEuropeFijiFranceGermanyGhanaGreeceGrenadaGuatemalaGuyanaHaitiHondurasHong KongHungaryIndiaIndonesiaIranIraqIrelandIsraelItalyJamaicaJapanJordanKazakhstanKenyaKoreaKuwaitLaosLatin AmericaLatviaLebanonLiberiaLithuaniaMalaysiaMexicoMicronesiaMiddle AfricaMoldovaMoroccoNepalNetherlandsNicaraguaNigeriaNorth AmericaNorth MacedoniaNorthern AfricaNorthern EuropeNorwayOceaniaPakistanPanamaPeruPhilippinesPolandPortugalRomaniaRussiaSaudi ArabiaScotlandSenegalSerbiaSierra LeoneSingaporeSomaliaSouth AfricaSouth AmericaSouth Central AsiaSouth Eastern AsiaSouthern EuropeSpainSri LankaSt. Vincent and the GrenadinesSudanSwedenSwitzerlandSyriaTaiwanThailandTrinidad and TobagoTurkeyUgandaUkraineUruguayUzbekistanVenezuelaVietnamWest IndiesWestern AfricaWestern AsiaWestern EuropeYemenZaireZimbabweAzores
Latvian
Race
Ancestry
AfghanAfricanAlaska NativeAlaskan AthabascanAlbanianAleutAlsatianAmericanApacheArabArapahoArgentineanArmenianAssyrian/Chaldean/SyriacAustralianAustrianBahamianBangladeshiBarbadianBasqueBelgianBelizeanBermudanBhutaneseBlackfeetBolivianBrazilianBritishBritish West IndianBulgarianBurmeseCajunCambodianCanadianCape VerdeanCarpatho RusynCelticCentral AmericanCentral American IndianCherokeeCheyenneChickasawChileanChineseChippewaChoctawColombianColvilleComancheCosta RicanCreeCreekCroatianCrowCubanCypriotCzechCzechoslovakianDanishDelawareDominicanDutchDutch West IndianEastern EuropeanEcuadorianEgyptianEnglishEstonianEthiopianEuropeanFijianFilipinoFinnishFrenchFrench American IndianFrench CanadianGermanGerman RussianGhanaianGreekGuamanian/ChamorroGuatemalanGuyaneseHaitianHmongHonduranHopiHoumaHungarianIcelanderIndian (Asian)IndonesianInupiatIranianIraqiIrishIroquoisIsraeliItalianJamaicanJapaneseJordanianKenyanKiowaKoreanLaotianLatvianLebaneseLiberianLithuanianLumbeeLuxembourgerMacedonianMalaysianMalteseMarshalleseMenomineeMexicanMexican American IndianMongolianMoroccanNative HawaiianNavajoNepaleseNew ZealanderNicaraguanNigerianNorthern EuropeanNorwegianOkinawanOsageOttawaPaiutePakistaniPalestinianPanamanianParaguayanPennsylvania GermanPeruvianPimaPolishPortuguesePotawatomiPuebloPuerto RicanPuget Sound SalishRomanianRussianSalvadoranSamoanScandinavianScotch-IrishScottishSeminoleSenegaleseSerbianShoshoneSierra LeoneanSiouxSlavicSlovakSloveneSomaliSouth AfricanSouth AmericanSouth American IndianSoviet UnionSpaniardSpanishSpanish AmericanSpanish American IndianSri LankanSubsaharan AfricanSudaneseSwedishSwissSyrianTaiwaneseThaiTlingit-HaidaTohono O'OdhamTonganTrinidadian and TobagonianTsimshianTurkishU.S. Virgin IslanderUgandanUkrainianUruguayanUteVenezuelanVietnameseWelshWest IndianYakamaYaquiYugoslavianYumanYup'ikZimbabwean
Immigration
NonimmigrantsImmigrantsAfghanistanAfricaAlbaniaArgentinaArmeniaAsiaAustraliaAustriaBahamasBangladeshBarbadosBelarusBelgiumBelizeBoliviaBosnia and HerzegovinaBrazilBulgariaBurma/MyanmarCabo VerdeCambodiaCameroonCanadaCaribbeanCentral AmericaChileChinaColombiaCongoCosta RicaCroatiaCubaCzechoslovakiaDenmarkDominicaDominican RepublicEastern AfricaEastern AsiaEastern EuropeEcuadorEgyptEl SalvadorEnglandEritreaEthiopiaEuropeFijiFranceGermanyGhanaGreeceGrenadaGuatemalaGuyanaHaitiHondurasHong KongHungaryIndiaIndonesiaIranIraqIrelandIsraelItalyJamaicaJapanJordanKazakhstanKenyaKoreaKuwaitLaosLatin AmericaLatviaLebanonLiberiaLithuaniaMalaysiaMexicoMicronesiaMiddle AfricaMoldovaMoroccoNepalNetherlandsNicaraguaNigeriaNorth AmericaNorth MacedoniaNorthern AfricaNorthern EuropeNorwayOceaniaPakistanPanamaPeruPhilippinesPolandPortugalRomaniaRussiaSaudi ArabiaScotlandSenegalSerbiaSierra LeoneSingaporeSomaliaSouth AfricaSouth AmericaSouth Eastern AsiaSouthern EuropeSpainSri LankaSt. Vincent and the GrenadinesSudanSwedenSwitzerlandSyriaTaiwanThailandTrinidad and TobagoTurkeyUgandaUkraineUruguayUzbekistanVenezuelaVietnamWest IndiesWestern AfricaWestern AsiaWestern EuropeYemenZaireZimbabweAzores
6th Grade
Income
Poverty
Unemployment
Labor Participation
Family Structure
Vehicle Availability
Education Level
Disability

6th Grade Comparison

Immigrants from South Central Asia

Latvians

Good
Exceptional
97.2%
6TH GRADE
78.1/ 100
METRIC RATING
147th/ 347
METRIC RANK
97.9%
6TH GRADE
99.9/ 100
METRIC RATING
40th/ 347
METRIC RANK

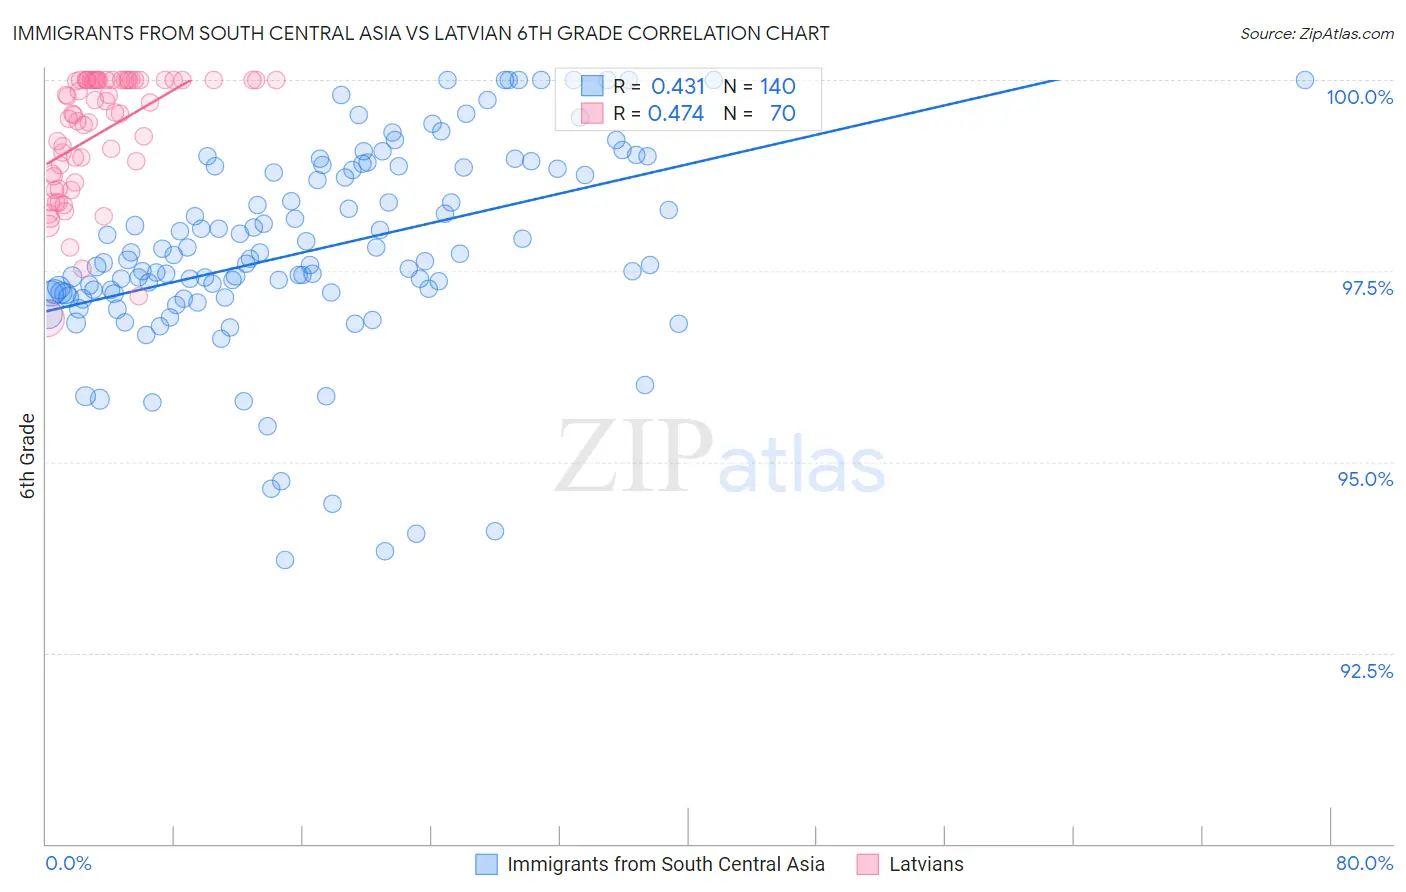
Immigrants from South Central Asia vs Latvian 6th Grade Correlation Chart

The statistical analysis conducted on geographies consisting of 473,113,181 people shows a moderate positive correlation between the proportion of Immigrants from South Central Asia and percentage of population with at least 6th grade education in the United States with a correlation coefficient (R) of 0.431 and weighted average of 97.2%. Similarly, the statistical analysis conducted on geographies consisting of 220,726,452 people shows a moderate positive correlation between the proportion of Latvians and percentage of population with at least 6th grade education in the United States with a correlation coefficient (R) of 0.474 and weighted average of 97.9%, a difference of 0.71%.
Immigrants from South Central Asia vs Latvian 6th Grade

6th Grade Correlation Summary

MeasurementImmigrants from South Central AsiaLatvian
Minimum93.7%96.9%
Maximum100.0%100.0%
Range6.3%3.1%
Mean97.8%99.3%
Median97.6%99.6%
Interquartile 25% (IQ1)97.2%98.7%
Interquartile 75% (IQ3)98.8%100.0%
Interquartile Range (IQR)1.6%1.3%
Standard Deviation (Sample)1.3%0.79%
Standard Deviation (Population)1.3%0.79%

Similar Demographics by 6th Grade

Demographics Similar to Immigrants from South Central Asia by 6th Grade

In terms of 6th grade, the demographic groups most similar to Immigrants from South Central Asia are Immigrants from Greece (97.2%, a difference of 0.0%), Spaniard (97.2%, a difference of 0.010%), Hopi (97.2%, a difference of 0.010%), Immigrants from Israel (97.2%, a difference of 0.010%), and Immigrants from Bosnia and Herzegovina (97.2%, a difference of 0.020%).
DemographicsRating | Rank6th Grade
Immigrants | North Macedonia
85.5
/100
|
#140
Excellent
97.2%
Seminole
84.8
/100
|
#141
Excellent
97.2%
Jordanians
84.6
/100
|
#142
Excellent
97.2%
Pima
82.9
/100
|
#143
Excellent
97.2%
Israelis
82.9
/100
|
#144
Excellent
97.2%
Spaniards
80.1
/100
|
#145
Excellent
97.2%
Hopi
78.8
/100
|
#146
Good
97.2%
Immigrants | South Central Asia
78.1
/100
|
#147
Good
97.2%
Immigrants | Greece
77.8
/100
|
#148
Good
97.2%
Immigrants | Israel
76.0
/100
|
#149
Good
97.2%
Immigrants | Bosnia and Herzegovina
74.8
/100
|
#150
Good
97.2%
French American Indians
74.0
/100
|
#151
Good
97.2%
Immigrants | Jordan
73.0
/100
|
#152
Good
97.2%
Immigrants | Eastern Europe
72.6
/100
|
#153
Good
97.2%
Soviet Union
71.5
/100
|
#154
Good
97.2%

Demographics Similar to Latvians by 6th Grade

In terms of 6th grade, the demographic groups most similar to Latvians are Belgian (97.9%, a difference of 0.010%), Luxembourger (97.9%, a difference of 0.010%), British (97.9%, a difference of 0.030%), Eastern European (97.9%, a difference of 0.030%), and Chinese (97.9%, a difference of 0.040%).
DemographicsRating | Rank6th Grade
Chippewa
100.0
/100
|
#33
Exceptional
97.9%
Swiss
100.0
/100
|
#34
Exceptional
97.9%
Chinese
100.0
/100
|
#35
Exceptional
97.9%
Italians
100.0
/100
|
#36
Exceptional
97.9%
British
100.0
/100
|
#37
Exceptional
97.9%
Belgians
100.0
/100
|
#38
Exceptional
97.9%
Luxembourgers
99.9
/100
|
#39
Exceptional
97.9%
Latvians
99.9
/100
|
#40
Exceptional
97.9%
Eastern Europeans
99.9
/100
|
#41
Exceptional
97.9%
Hungarians
99.9
/100
|
#42
Exceptional
97.8%
Northern Europeans
99.9
/100
|
#43
Exceptional
97.8%
Czechoslovakians
99.9
/100
|
#44
Exceptional
97.8%
Bulgarians
99.9
/100
|
#45
Exceptional
97.8%
Arapaho
99.9
/100
|
#46
Exceptional
97.8%
Native Hawaiians
99.9
/100
|
#47
Exceptional
97.8%