Immigrants from Portugal vs British 2nd Grade

COMPARE

Immigrants from Portugal
Race
Ancestry
AfghanAfricanAlaska NativeAlaskan AthabascanAlbanianAleutAlsatianAmericanApacheArabArapahoArgentineanArmenianAssyrian/Chaldean/SyriacAustralianAustrianBahamianBangladeshiBarbadianBasqueBelgianBelizeanBermudanBhutaneseBlackfeetBolivianBrazilianBritish West IndianBulgarianBurmeseCajunCambodianCanadianCape VerdeanCarpatho RusynCelticCentral AmericanCentral American IndianCherokeeCheyenneChickasawChileanChineseChippewaChoctawColombianColvilleComancheCosta RicanCreeCreekCroatianCrowCubanCypriotCzechCzechoslovakianDanishDelawareDominicanDutchDutch West IndianEastern EuropeanEcuadorianEgyptianEnglishEstonianEthiopianEuropeanFijianFilipinoFinnishFrenchFrench American IndianFrench CanadianGermanGerman RussianGhanaianGreekGuamanian/ChamorroGuatemalanGuyaneseHaitianHmongHonduranHopiHoumaHungarianIcelanderIndian (Asian)IndonesianInupiatIranianIraqiIrishIroquoisIsraeliItalianJamaicanJapaneseJordanianKenyanKiowaKoreanLaotianLatvianLebaneseLiberianLithuanianLumbeeLuxembourgerMacedonianMalaysianMalteseMarshalleseMenomineeMexicanMexican American IndianMongolianMoroccanNative HawaiianNavajoNepaleseNew ZealanderNicaraguanNigerianNorthern EuropeanNorwegianOkinawanOsageOttawaPaiutePakistaniPalestinianPanamanianParaguayanPennsylvania GermanPeruvianPimaPolishPortuguesePotawatomiPuebloPuerto RicanPuget Sound SalishRomanianRussianSalvadoranSamoanScandinavianScotch-IrishScottishSeminoleSenegaleseSerbianShoshoneSierra LeoneanSiouxSlavicSlovakSloveneSomaliSouth AfricanSouth AmericanSouth American IndianSoviet UnionSpaniardSpanishSpanish AmericanSpanish American IndianSri LankanSubsaharan AfricanSudaneseSwedishSwissSyrianTaiwaneseThaiTlingit-HaidaTohono O'OdhamTonganTrinidadian and TobagonianTsimshianTurkishU.S. Virgin IslanderUgandanUkrainianUruguayanUteVenezuelanVietnameseWelshWest IndianYakamaYaquiYugoslavianYumanYup'ikZimbabwean
Immigration
NonimmigrantsImmigrantsAfghanistanAfricaAlbaniaArgentinaArmeniaAsiaAustraliaAustriaBahamasBangladeshBarbadosBelarusBelgiumBelizeBoliviaBosnia and HerzegovinaBrazilBulgariaBurma/MyanmarCabo VerdeCambodiaCameroonCanadaCaribbeanCentral AmericaChileChinaColombiaCongoCosta RicaCroatiaCubaCzechoslovakiaDenmarkDominicaDominican RepublicEastern AfricaEastern AsiaEastern EuropeEcuadorEgyptEl SalvadorEnglandEritreaEthiopiaEuropeFijiFranceGermanyGhanaGreeceGrenadaGuatemalaGuyanaHaitiHondurasHong KongHungaryIndiaIndonesiaIranIraqIrelandIsraelItalyJamaicaJapanJordanKazakhstanKenyaKoreaKuwaitLaosLatin AmericaLatviaLebanonLiberiaLithuaniaMalaysiaMexicoMicronesiaMiddle AfricaMoldovaMoroccoNepalNetherlandsNicaraguaNigeriaNorth AmericaNorth MacedoniaNorthern AfricaNorthern EuropeNorwayOceaniaPakistanPanamaPeruPhilippinesPolandPortugalRomaniaRussiaSaudi ArabiaScotlandSenegalSerbiaSierra LeoneSingaporeSomaliaSouth AfricaSouth AmericaSouth Central AsiaSouth Eastern AsiaSouthern EuropeSpainSri LankaSt. Vincent and the GrenadinesSudanSwedenSwitzerlandSyriaTaiwanThailandTrinidad and TobagoTurkeyUgandaUkraineUruguayUzbekistanVenezuelaVietnamWest IndiesWestern AfricaWestern AsiaWestern EuropeYemenZaireZimbabweAzores
British
Race
Ancestry
AfghanAfricanAlaska NativeAlaskan AthabascanAlbanianAleutAlsatianAmericanApacheArabArapahoArgentineanArmenianAssyrian/Chaldean/SyriacAustralianAustrianBahamianBangladeshiBarbadianBasqueBelgianBelizeanBermudanBhutaneseBlackfeetBolivianBrazilianBritishBritish West IndianBulgarianBurmeseCajunCambodianCanadianCape VerdeanCarpatho RusynCelticCentral AmericanCentral American IndianCherokeeCheyenneChickasawChileanChineseChippewaChoctawColombianColvilleComancheCosta RicanCreeCreekCroatianCrowCubanCypriotCzechCzechoslovakianDanishDelawareDominicanDutchDutch West IndianEastern EuropeanEcuadorianEgyptianEnglishEstonianEthiopianEuropeanFijianFilipinoFinnishFrenchFrench American IndianFrench CanadianGermanGerman RussianGhanaianGreekGuamanian/ChamorroGuatemalanGuyaneseHaitianHmongHonduranHopiHoumaHungarianIcelanderIndian (Asian)IndonesianInupiatIranianIraqiIrishIroquoisIsraeliItalianJamaicanJapaneseJordanianKenyanKiowaKoreanLaotianLatvianLebaneseLiberianLithuanianLumbeeLuxembourgerMacedonianMalaysianMalteseMarshalleseMenomineeMexicanMexican American IndianMongolianMoroccanNative HawaiianNavajoNepaleseNew ZealanderNicaraguanNigerianNorthern EuropeanNorwegianOkinawanOsageOttawaPaiutePakistaniPalestinianPanamanianParaguayanPennsylvania GermanPeruvianPimaPolishPortuguesePotawatomiPuebloPuerto RicanPuget Sound SalishRomanianRussianSalvadoranSamoanScandinavianScotch-IrishScottishSeminoleSenegaleseSerbianShoshoneSierra LeoneanSiouxSlavicSlovakSloveneSomaliSouth AfricanSouth AmericanSouth American IndianSoviet UnionSpaniardSpanishSpanish AmericanSpanish American IndianSri LankanSubsaharan AfricanSudaneseSwedishSwissSyrianTaiwaneseThaiTlingit-HaidaTohono O'OdhamTonganTrinidadian and TobagonianTsimshianTurkishU.S. Virgin IslanderUgandanUkrainianUruguayanUteVenezuelanVietnameseWelshWest IndianYakamaYaquiYugoslavianYumanYup'ikZimbabwean
Immigration
NonimmigrantsImmigrantsAfghanistanAfricaAlbaniaArgentinaArmeniaAsiaAustraliaAustriaBahamasBangladeshBarbadosBelarusBelgiumBelizeBoliviaBosnia and HerzegovinaBrazilBulgariaBurma/MyanmarCabo VerdeCambodiaCameroonCanadaCaribbeanCentral AmericaChileChinaColombiaCongoCosta RicaCroatiaCubaCzechoslovakiaDenmarkDominicaDominican RepublicEastern AfricaEastern AsiaEastern EuropeEcuadorEgyptEl SalvadorEnglandEritreaEthiopiaEuropeFijiFranceGermanyGhanaGreeceGrenadaGuatemalaGuyanaHaitiHondurasHong KongHungaryIndiaIndonesiaIranIraqIrelandIsraelItalyJamaicaJapanJordanKazakhstanKenyaKoreaKuwaitLaosLatin AmericaLatviaLebanonLiberiaLithuaniaMalaysiaMexicoMicronesiaMiddle AfricaMoldovaMoroccoNepalNetherlandsNicaraguaNigeriaNorth AmericaNorth MacedoniaNorthern AfricaNorthern EuropeNorwayOceaniaPakistanPanamaPeruPhilippinesPolandRomaniaRussiaSaudi ArabiaScotlandSenegalSerbiaSierra LeoneSingaporeSomaliaSouth AfricaSouth AmericaSouth Central AsiaSouth Eastern AsiaSouthern EuropeSpainSri LankaSt. Vincent and the GrenadinesSudanSwedenSwitzerlandSyriaTaiwanThailandTrinidad and TobagoTurkeyUgandaUkraineUruguayUzbekistanVenezuelaVietnamWest IndiesWestern AfricaWestern AsiaWestern EuropeYemenZaireZimbabweAzores
2nd Grade
Income
Poverty
Unemployment
Labor Participation
Family Structure
Vehicle Availability
Education Level
Disability

2nd Grade Comparison

Immigrants from Portugal

British

Tragic
Exceptional
97.2%
2ND GRADE
0.0/ 100
METRIC RATING
287th/ 347
METRIC RANK
98.5%
2ND GRADE
100.0/ 100
METRIC RATING
36th/ 347
METRIC RANK

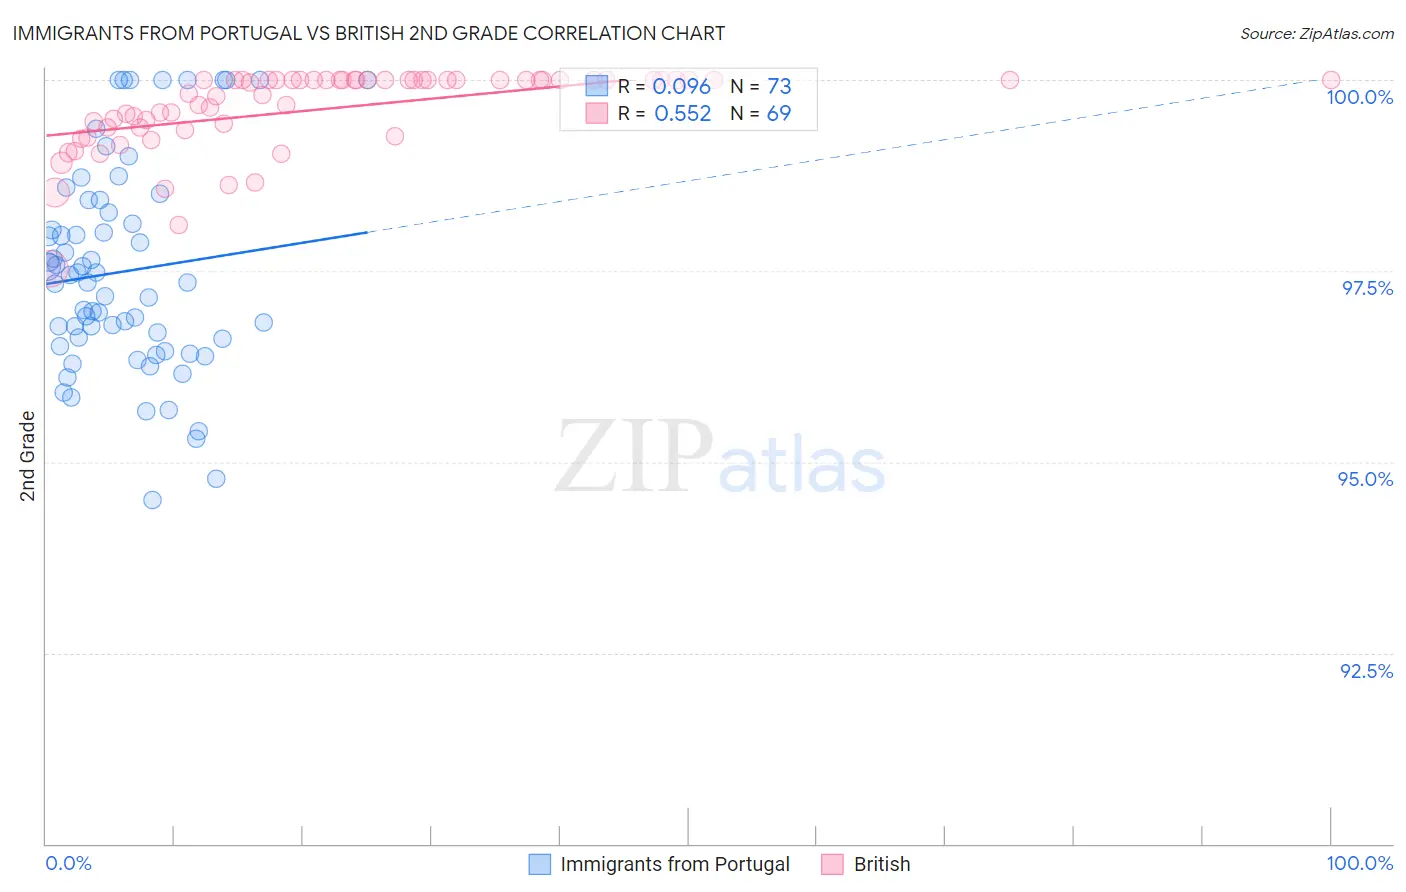
Immigrants from Portugal vs British 2nd Grade Correlation Chart

The statistical analysis conducted on geographies consisting of 174,792,107 people shows a slight positive correlation between the proportion of Immigrants from Portugal and percentage of population with at least 2nd grade education in the United States with a correlation coefficient (R) of 0.096 and weighted average of 97.2%. Similarly, the statistical analysis conducted on geographies consisting of 531,462,526 people shows a substantial positive correlation between the proportion of British and percentage of population with at least 2nd grade education in the United States with a correlation coefficient (R) of 0.552 and weighted average of 98.5%, a difference of 1.3%.
Immigrants from Portugal vs British 2nd Grade

2nd Grade Correlation Summary

MeasurementImmigrants from PortugalBritish
Minimum94.5%97.5%
Maximum100.0%100.0%
Range5.5%2.5%
Mean97.5%99.6%
Median97.4%100.0%
Interquartile 25% (IQ1)96.6%99.4%
Interquartile 75% (IQ3)98.3%100.0%
Interquartile Range (IQR)1.8%0.64%
Standard Deviation (Sample)1.4%0.53%
Standard Deviation (Population)1.3%0.53%

Similar Demographics by 2nd Grade

Demographics Similar to Immigrants from Portugal by 2nd Grade

In terms of 2nd grade, the demographic groups most similar to Immigrants from Portugal are Immigrants from Hong Kong (97.2%, a difference of 0.0%), Immigrants from Barbados (97.2%, a difference of 0.0%), Immigrants from Thailand (97.2%, a difference of 0.010%), Immigrants from Trinidad and Tobago (97.2%, a difference of 0.020%), and Immigrants from West Indies (97.2%, a difference of 0.020%).
DemographicsRating | Rank2nd Grade
Afghans
0.1
/100
|
#280
Tragic
97.3%
Trinidadians and Tobagonians
0.1
/100
|
#281
Tragic
97.3%
Barbadians
0.1
/100
|
#282
Tragic
97.3%
Immigrants | Trinidad and Tobago
0.0
/100
|
#283
Tragic
97.2%
Immigrants | West Indies
0.0
/100
|
#284
Tragic
97.2%
Immigrants | Hong Kong
0.0
/100
|
#285
Tragic
97.2%
Immigrants | Barbados
0.0
/100
|
#286
Tragic
97.2%
Immigrants | Portugal
0.0
/100
|
#287
Tragic
97.2%
Immigrants | Thailand
0.0
/100
|
#288
Tragic
97.2%
Houma
0.0
/100
|
#289
Tragic
97.2%
Immigrants | St. Vincent and the Grenadines
0.0
/100
|
#290
Tragic
97.2%
Immigrants | Afghanistan
0.0
/100
|
#291
Tragic
97.2%
Immigrants | Eritrea
0.0
/100
|
#292
Tragic
97.2%
British West Indians
0.0
/100
|
#293
Tragic
97.2%
Malaysians
0.0
/100
|
#294
Tragic
97.1%

Demographics Similar to British by 2nd Grade

In terms of 2nd grade, the demographic groups most similar to British are Chinese (98.5%, a difference of 0.020%), Swiss (98.5%, a difference of 0.020%), Italian (98.4%, a difference of 0.020%), Latvian (98.4%, a difference of 0.030%), and Chippewa (98.4%, a difference of 0.030%).
DemographicsRating | Rank2nd Grade
French
100.0
/100
|
#29
Exceptional
98.5%
Europeans
100.0
/100
|
#30
Exceptional
98.5%
Czechs
100.0
/100
|
#31
Exceptional
98.5%
French Canadians
100.0
/100
|
#32
Exceptional
98.5%
Scandinavians
100.0
/100
|
#33
Exceptional
98.5%
Chinese
100.0
/100
|
#34
Exceptional
98.5%
Swiss
100.0
/100
|
#35
Exceptional
98.5%
British
100.0
/100
|
#36
Exceptional
98.5%
Italians
99.9
/100
|
#37
Exceptional
98.4%
Latvians
99.9
/100
|
#38
Exceptional
98.4%
Chippewa
99.9
/100
|
#39
Exceptional
98.4%
Luxembourgers
99.9
/100
|
#40
Exceptional
98.4%
Eastern Europeans
99.9
/100
|
#41
Exceptional
98.4%
Native Hawaiians
99.9
/100
|
#42
Exceptional
98.4%
Belgians
99.9
/100
|
#43
Exceptional
98.4%