Immigrants from Portugal vs Belizean 2nd Grade
COMPARE
Immigrants from Portugal
Belizean
2nd Grade
2nd Grade Comparison
Immigrants from Portugal
Belizeans
97.2%
2ND GRADE
0.0/ 100
METRIC RATING
287th/ 347
METRIC RANK
96.8%
2ND GRADE
0.0/ 100
METRIC RATING
309th/ 347
METRIC RANK
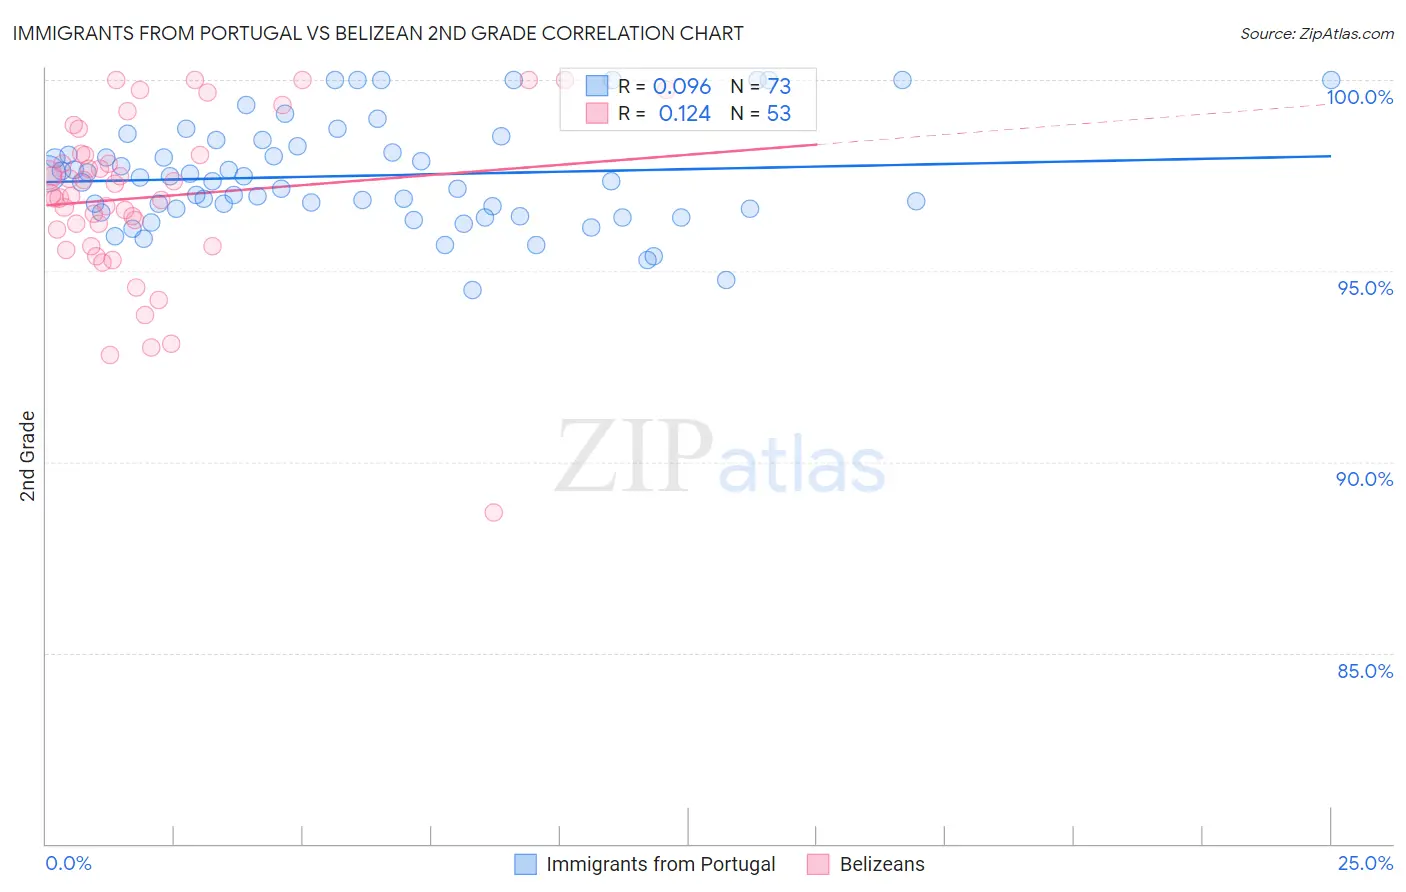
Immigrants from Portugal vs Belizean 2nd Grade Correlation Chart
The statistical analysis conducted on geographies consisting of 174,792,107 people shows a slight positive correlation between the proportion of Immigrants from Portugal and percentage of population with at least 2nd grade education in the United States with a correlation coefficient (R) of 0.096 and weighted average of 97.2%. Similarly, the statistical analysis conducted on geographies consisting of 144,224,236 people shows a poor positive correlation between the proportion of Belizeans and percentage of population with at least 2nd grade education in the United States with a correlation coefficient (R) of 0.124 and weighted average of 96.8%, a difference of 0.40%.
2nd Grade Correlation Summary
| Measurement | Immigrants from Portugal | Belizean |
| Minimum | 94.5% | 88.7% |
| Maximum | 100.0% | 100.0% |
| Range | 5.5% | 11.3% |
| Mean | 97.5% | 96.9% |
| Median | 97.4% | 97.0% |
| Interquartile 25% (IQ1) | 96.6% | 95.9% |
| Interquartile 75% (IQ3) | 98.3% | 98.1% |
| Interquartile Range (IQR) | 1.8% | 2.2% |
| Standard Deviation (Sample) | 1.4% | 2.2% |
| Standard Deviation (Population) | 1.3% | 2.2% |
Similar Demographics by 2nd Grade
Demographics Similar to Immigrants from Portugal by 2nd Grade
In terms of 2nd grade, the demographic groups most similar to Immigrants from Portugal are Immigrants from Hong Kong (97.2%, a difference of 0.0%), Immigrants from Barbados (97.2%, a difference of 0.0%), Immigrants from Thailand (97.2%, a difference of 0.010%), Immigrants from Trinidad and Tobago (97.2%, a difference of 0.020%), and Immigrants from West Indies (97.2%, a difference of 0.020%).
| Demographics | Rating | Rank | 2nd Grade |
| Afghans | 0.1 /100 | #280 | Tragic 97.3% |
| Trinidadians and Tobagonians | 0.1 /100 | #281 | Tragic 97.3% |
| Barbadians | 0.1 /100 | #282 | Tragic 97.3% |
| Immigrants | Trinidad and Tobago | 0.0 /100 | #283 | Tragic 97.2% |
| Immigrants | West Indies | 0.0 /100 | #284 | Tragic 97.2% |
| Immigrants | Hong Kong | 0.0 /100 | #285 | Tragic 97.2% |
| Immigrants | Barbados | 0.0 /100 | #286 | Tragic 97.2% |
| Immigrants | Portugal | 0.0 /100 | #287 | Tragic 97.2% |
| Immigrants | Thailand | 0.0 /100 | #288 | Tragic 97.2% |
| Houma | 0.0 /100 | #289 | Tragic 97.2% |
| Immigrants | St. Vincent and the Grenadines | 0.0 /100 | #290 | Tragic 97.2% |
| Immigrants | Afghanistan | 0.0 /100 | #291 | Tragic 97.2% |
| Immigrants | Eritrea | 0.0 /100 | #292 | Tragic 97.2% |
| British West Indians | 0.0 /100 | #293 | Tragic 97.2% |
| Malaysians | 0.0 /100 | #294 | Tragic 97.1% |
Demographics Similar to Belizeans by 2nd Grade
In terms of 2nd grade, the demographic groups most similar to Belizeans are Sri Lankan (96.8%, a difference of 0.0%), Immigrants from the Azores (96.8%, a difference of 0.010%), Immigrants from Haiti (96.8%, a difference of 0.010%), Guyanese (96.8%, a difference of 0.010%), and Cape Verdean (96.8%, a difference of 0.020%).
| Demographics | Rating | Rank | 2nd Grade |
| Somalis | 0.0 /100 | #302 | Tragic 97.0% |
| Ecuadorians | 0.0 /100 | #303 | Tragic 96.9% |
| Immigrants | Caribbean | 0.0 /100 | #304 | Tragic 96.9% |
| Nicaraguans | 0.0 /100 | #305 | Tragic 96.9% |
| Immigrants | Somalia | 0.0 /100 | #306 | Tragic 96.9% |
| Immigrants | Azores | 0.0 /100 | #307 | Tragic 96.8% |
| Immigrants | Haiti | 0.0 /100 | #308 | Tragic 96.8% |
| Belizeans | 0.0 /100 | #309 | Tragic 96.8% |
| Sri Lankans | 0.0 /100 | #310 | Tragic 96.8% |
| Guyanese | 0.0 /100 | #311 | Tragic 96.8% |
| Cape Verdeans | 0.0 /100 | #312 | Tragic 96.8% |
| Hispanics or Latinos | 0.0 /100 | #313 | Tragic 96.8% |
| Immigrants | Ecuador | 0.0 /100 | #314 | Tragic 96.8% |
| Immigrants | Belize | 0.0 /100 | #315 | Tragic 96.8% |
| Hondurans | 0.0 /100 | #316 | Tragic 96.7% |