Immigrants from Portugal vs British Unemployment Among Ages 16 to 19 years

COMPARE

Immigrants from Portugal
Race
Ancestry
AfghanAfricanAlaska NativeAlaskan AthabascanAlbanianAleutAlsatianAmericanApacheArabArapahoArgentineanArmenianAssyrian/Chaldean/SyriacAustralianAustrianBahamianBangladeshiBarbadianBasqueBelgianBelizeanBermudanBhutaneseBlackfeetBolivianBrazilianBritish West IndianBulgarianBurmeseCajunCambodianCanadianCape VerdeanCarpatho RusynCelticCentral AmericanCentral American IndianCherokeeCheyenneChickasawChileanChineseChippewaChoctawColombianColvilleComancheCosta RicanCreeCreekCroatianCrowCubanCypriotCzechCzechoslovakianDanishDelawareDominicanDutchDutch West IndianEastern EuropeanEcuadorianEgyptianEnglishEstonianEthiopianEuropeanFijianFilipinoFinnishFrenchFrench American IndianFrench CanadianGermanGerman RussianGhanaianGreekGuamanian/ChamorroGuatemalanGuyaneseHaitianHmongHonduranHopiHoumaHungarianIcelanderIndian (Asian)IndonesianInupiatIranianIraqiIrishIroquoisIsraeliItalianJamaicanJapaneseJordanianKenyanKiowaKoreanLaotianLatvianLebaneseLiberianLithuanianLumbeeLuxembourgerMacedonianMalaysianMalteseMarshalleseMenomineeMexicanMexican American IndianMongolianMoroccanNative HawaiianNavajoNepaleseNew ZealanderNicaraguanNigerianNorthern EuropeanNorwegianOkinawanOsageOttawaPaiutePakistaniPalestinianPanamanianParaguayanPennsylvania GermanPeruvianPimaPolishPortuguesePotawatomiPuebloPuerto RicanPuget Sound SalishRomanianRussianSalvadoranSamoanScandinavianScotch-IrishScottishSeminoleSenegaleseSerbianShoshoneSierra LeoneanSiouxSlavicSlovakSloveneSomaliSouth AfricanSouth AmericanSouth American IndianSoviet UnionSpaniardSpanishSpanish AmericanSpanish American IndianSri LankanSubsaharan AfricanSudaneseSwedishSwissSyrianTaiwaneseThaiTlingit-HaidaTohono O'OdhamTonganTrinidadian and TobagonianTsimshianTurkishU.S. Virgin IslanderUgandanUkrainianUruguayanUteVenezuelanVietnameseWelshWest IndianYakamaYaquiYugoslavianYumanYup'ikZimbabwean
Immigration
NonimmigrantsImmigrantsAfghanistanAfricaAlbaniaArgentinaArmeniaAsiaAustraliaAustriaBahamasBangladeshBarbadosBelarusBelgiumBelizeBoliviaBosnia and HerzegovinaBrazilBulgariaBurma/MyanmarCabo VerdeCambodiaCameroonCanadaCaribbeanCentral AmericaChileChinaColombiaCongoCosta RicaCroatiaCubaCzechoslovakiaDenmarkDominicaDominican RepublicEastern AfricaEastern AsiaEastern EuropeEcuadorEgyptEl SalvadorEnglandEritreaEthiopiaEuropeFijiFranceGermanyGhanaGreeceGrenadaGuatemalaGuyanaHaitiHondurasHong KongHungaryIndiaIndonesiaIranIraqIrelandIsraelItalyJamaicaJapanJordanKazakhstanKenyaKoreaKuwaitLaosLatin AmericaLatviaLebanonLiberiaLithuaniaMalaysiaMexicoMicronesiaMiddle AfricaMoldovaMoroccoNepalNetherlandsNicaraguaNigeriaNorth AmericaNorth MacedoniaNorthern AfricaNorthern EuropeNorwayOceaniaPakistanPanamaPeruPhilippinesPolandPortugalRomaniaRussiaSaudi ArabiaScotlandSenegalSerbiaSierra LeoneSingaporeSomaliaSouth AfricaSouth AmericaSouth Central AsiaSouth Eastern AsiaSouthern EuropeSpainSri LankaSt. Vincent and the GrenadinesSudanSwedenSwitzerlandSyriaTaiwanThailandTrinidad and TobagoTurkeyUgandaUkraineUruguayUzbekistanVenezuelaVietnamWest IndiesWestern AfricaWestern AsiaWestern EuropeYemenZaireZimbabweAzores
British
Race
Ancestry
AfghanAfricanAlaska NativeAlaskan AthabascanAlbanianAleutAlsatianAmericanApacheArabArapahoArgentineanArmenianAssyrian/Chaldean/SyriacAustralianAustrianBahamianBangladeshiBarbadianBasqueBelgianBelizeanBermudanBhutaneseBlackfeetBolivianBrazilianBritishBritish West IndianBulgarianBurmeseCajunCambodianCanadianCape VerdeanCarpatho RusynCelticCentral AmericanCentral American IndianCherokeeCheyenneChickasawChileanChineseChippewaChoctawColombianColvilleComancheCosta RicanCreeCreekCroatianCrowCubanCypriotCzechCzechoslovakianDanishDelawareDominicanDutchDutch West IndianEastern EuropeanEcuadorianEgyptianEnglishEstonianEthiopianEuropeanFijianFilipinoFinnishFrenchFrench American IndianFrench CanadianGermanGerman RussianGhanaianGreekGuamanian/ChamorroGuatemalanGuyaneseHaitianHmongHonduranHopiHoumaHungarianIcelanderIndian (Asian)IndonesianInupiatIranianIraqiIrishIroquoisIsraeliItalianJamaicanJapaneseJordanianKenyanKiowaKoreanLaotianLatvianLebaneseLiberianLithuanianLumbeeLuxembourgerMacedonianMalaysianMalteseMarshalleseMenomineeMexicanMexican American IndianMongolianMoroccanNative HawaiianNavajoNepaleseNew ZealanderNicaraguanNigerianNorthern EuropeanNorwegianOkinawanOsageOttawaPaiutePakistaniPalestinianPanamanianParaguayanPennsylvania GermanPeruvianPimaPolishPortuguesePotawatomiPuebloPuerto RicanPuget Sound SalishRomanianRussianSalvadoranSamoanScandinavianScotch-IrishScottishSeminoleSenegaleseSerbianShoshoneSierra LeoneanSiouxSlavicSlovakSloveneSomaliSouth AfricanSouth AmericanSouth American IndianSoviet UnionSpaniardSpanishSpanish AmericanSpanish American IndianSri LankanSubsaharan AfricanSudaneseSwedishSwissSyrianTaiwaneseThaiTlingit-HaidaTohono O'OdhamTonganTrinidadian and TobagonianTsimshianTurkishU.S. Virgin IslanderUgandanUkrainianUruguayanUteVenezuelanVietnameseWelshWest IndianYakamaYaquiYugoslavianYumanYup'ikZimbabwean
Immigration
NonimmigrantsImmigrantsAfghanistanAfricaAlbaniaArgentinaArmeniaAsiaAustraliaAustriaBahamasBangladeshBarbadosBelarusBelgiumBelizeBoliviaBosnia and HerzegovinaBrazilBulgariaBurma/MyanmarCabo VerdeCambodiaCameroonCanadaCaribbeanCentral AmericaChileChinaColombiaCongoCosta RicaCroatiaCubaCzechoslovakiaDenmarkDominicaDominican RepublicEastern AfricaEastern AsiaEastern EuropeEcuadorEgyptEl SalvadorEnglandEritreaEthiopiaEuropeFijiFranceGermanyGhanaGreeceGrenadaGuatemalaGuyanaHaitiHondurasHong KongHungaryIndiaIndonesiaIranIraqIrelandIsraelItalyJamaicaJapanJordanKazakhstanKenyaKoreaKuwaitLaosLatin AmericaLatviaLebanonLiberiaLithuaniaMalaysiaMexicoMicronesiaMiddle AfricaMoldovaMoroccoNepalNetherlandsNicaraguaNigeriaNorth AmericaNorth MacedoniaNorthern AfricaNorthern EuropeNorwayOceaniaPakistanPanamaPeruPhilippinesPolandRomaniaRussiaSaudi ArabiaScotlandSenegalSerbiaSierra LeoneSingaporeSomaliaSouth AfricaSouth AmericaSouth Central AsiaSouth Eastern AsiaSouthern EuropeSpainSri LankaSt. Vincent and the GrenadinesSudanSwedenSwitzerlandSyriaTaiwanThailandTrinidad and TobagoTurkeyUgandaUkraineUruguayUzbekistanVenezuelaVietnamWest IndiesWestern AfricaWestern AsiaWestern EuropeYemenZaireZimbabweAzores
Unemployment Among Ages 16 to 19 years
Income
Poverty
Unemployment
Labor Participation
Family Structure
Vehicle Availability
Education Level
Disability

Unemployment Among Ages 16 to 19 years Comparison

Immigrants from Portugal

British

Fair
Exceptional
17.8%
UNEMPLOYMENT AMONG AGES 16 TO 19 YEARS
27.2/ 100
METRIC RATING
202nd/ 347
METRIC RANK
16.5%
UNEMPLOYMENT AMONG AGES 16 TO 19 YEARS
99.5/ 100
METRIC RATING
54th/ 347
METRIC RANK

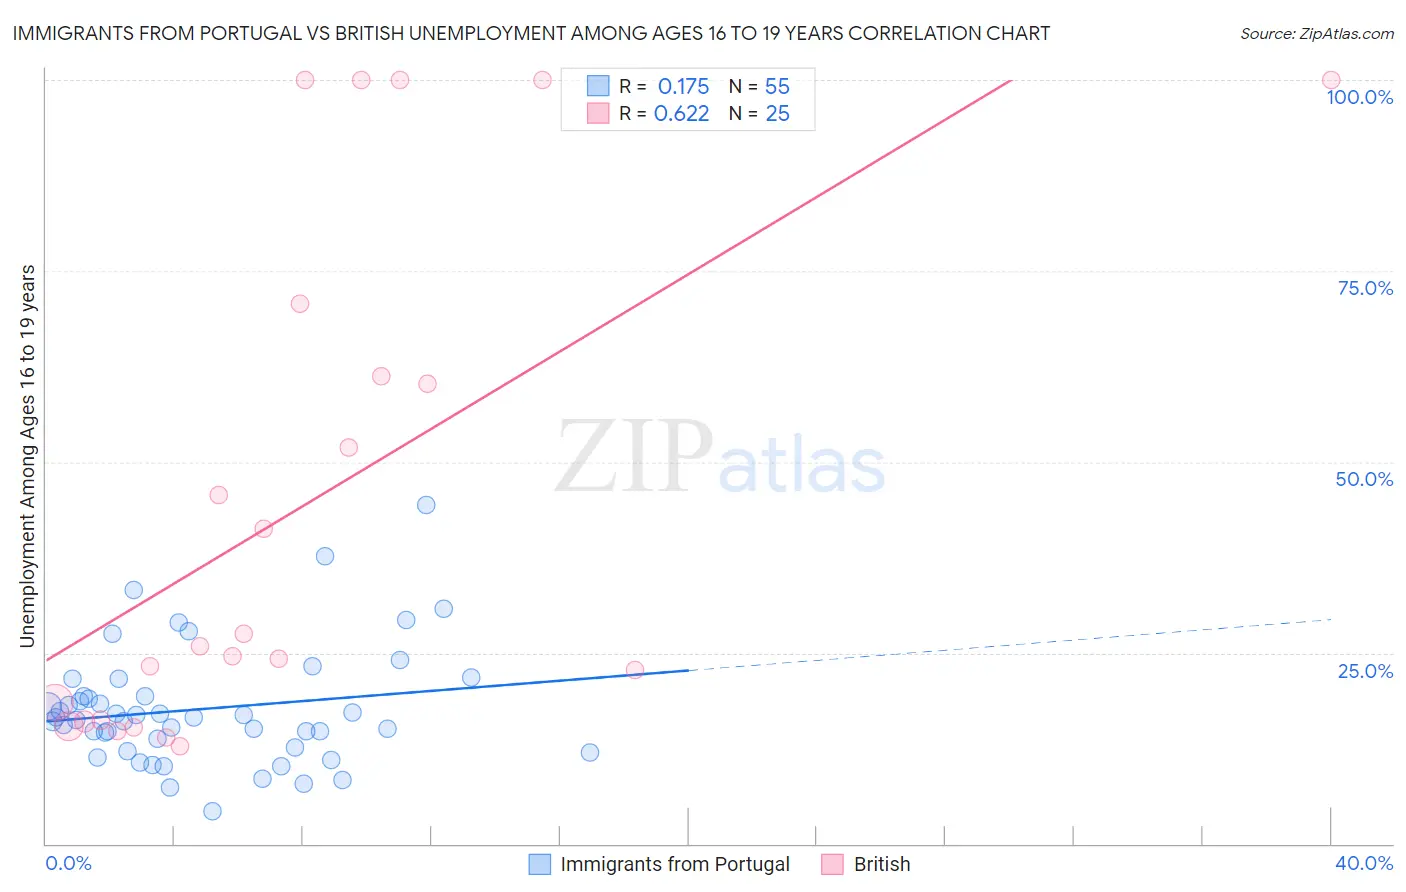
Immigrants from Portugal vs British Unemployment Among Ages 16 to 19 years Correlation Chart

The statistical analysis conducted on geographies consisting of 168,658,377 people shows a poor positive correlation between the proportion of Immigrants from Portugal and unemployment rate among population between the ages 16 and 19 in the United States with a correlation coefficient (R) of 0.175 and weighted average of 17.8%. Similarly, the statistical analysis conducted on geographies consisting of 483,657,198 people shows a significant positive correlation between the proportion of British and unemployment rate among population between the ages 16 and 19 in the United States with a correlation coefficient (R) of 0.622 and weighted average of 16.5%, a difference of 8.1%.
Immigrants from Portugal vs British Unemployment Among Ages 16 to 19 years

Unemployment Among Ages 16 to 19 years Correlation Summary

MeasurementImmigrants from PortugalBritish
Minimum4.2%12.7%
Maximum44.3%100.0%
Range40.1%87.3%
Mean17.7%44.1%
Median16.5%25.8%
Interquartile 25% (IQ1)12.6%16.1%
Interquartile 75% (IQ3)19.3%66.0%
Interquartile Range (IQR)6.7%49.9%
Standard Deviation (Sample)7.6%32.8%
Standard Deviation (Population)7.6%32.2%

Similar Demographics by Unemployment Among Ages 16 to 19 years

Demographics Similar to Immigrants from Portugal by Unemployment Among Ages 16 to 19 years

In terms of unemployment among ages 16 to 19 years, the demographic groups most similar to Immigrants from Portugal are Immigrants from Ethiopia (17.8%, a difference of 0.010%), Immigrants from Fiji (17.8%, a difference of 0.030%), Immigrants from Ireland (17.8%, a difference of 0.080%), Ethiopian (17.8%, a difference of 0.14%), and Immigrants from Czechoslovakia (17.8%, a difference of 0.15%).
DemographicsRating | RankUnemployment Among Ages 16 to 19 years
Immigrants | Peru
37.3
/100
|
#195
Fair
17.7%
Alaskan Athabascans
34.1
/100
|
#196
Fair
17.7%
Immigrants | Czechoslovakia
29.8
/100
|
#197
Fair
17.8%
Ethiopians
29.6
/100
|
#198
Fair
17.8%
Immigrants | Ireland
28.5
/100
|
#199
Fair
17.8%
Immigrants | Fiji
27.7
/100
|
#200
Fair
17.8%
Immigrants | Ethiopia
27.4
/100
|
#201
Fair
17.8%
Immigrants | Portugal
27.2
/100
|
#202
Fair
17.8%
Immigrants | Eastern Europe
23.6
/100
|
#203
Fair
17.8%
Immigrants | Nonimmigrants
20.9
/100
|
#204
Fair
17.9%
Assyrians/Chaldeans/Syriacs
20.8
/100
|
#205
Fair
17.9%
Immigrants | Southern Europe
18.9
/100
|
#206
Poor
17.9%
Liberians
18.6
/100
|
#207
Poor
17.9%
Hawaiians
16.8
/100
|
#208
Poor
17.9%
Cherokee
15.7
/100
|
#209
Poor
17.9%

Demographics Similar to British by Unemployment Among Ages 16 to 19 years

In terms of unemployment among ages 16 to 19 years, the demographic groups most similar to British are Czechoslovakian (16.5%, a difference of 0.020%), Slovene (16.4%, a difference of 0.050%), Sri Lankan (16.5%, a difference of 0.050%), Welsh (16.4%, a difference of 0.14%), and Lebanese (16.4%, a difference of 0.17%).
DemographicsRating | RankUnemployment Among Ages 16 to 19 years
Immigrants | Vietnam
99.7
/100
|
#47
Exceptional
16.4%
Maltese
99.7
/100
|
#48
Exceptional
16.4%
Iraqis
99.7
/100
|
#49
Exceptional
16.4%
Bhutanese
99.6
/100
|
#50
Exceptional
16.4%
Lebanese
99.6
/100
|
#51
Exceptional
16.4%
Welsh
99.6
/100
|
#52
Exceptional
16.4%
Slovenes
99.6
/100
|
#53
Exceptional
16.4%
British
99.5
/100
|
#54
Exceptional
16.5%
Czechoslovakians
99.5
/100
|
#55
Exceptional
16.5%
Sri Lankans
99.5
/100
|
#56
Exceptional
16.5%
Immigrants | Jordan
99.4
/100
|
#57
Exceptional
16.5%
Immigrants | Uganda
99.4
/100
|
#58
Exceptional
16.5%
Irish
99.4
/100
|
#59
Exceptional
16.5%
Menominee
99.3
/100
|
#60
Exceptional
16.6%
Immigrants | Cuba
99.2
/100
|
#61
Exceptional
16.6%