Immigrants from England vs Taiwanese College, 1 year or more

COMPARE

Immigrants from England
Race
Ancestry
AfghanAfricanAlaska NativeAlaskan AthabascanAlbanianAleutAlsatianAmericanApacheArabArapahoArgentineanArmenianAssyrian/Chaldean/SyriacAustralianAustrianBahamianBangladeshiBarbadianBasqueBelgianBelizeanBermudanBhutaneseBlackfeetBolivianBrazilianBritishBritish West IndianBulgarianBurmeseCajunCambodianCanadianCape VerdeanCarpatho RusynCelticCentral AmericanCentral American IndianCherokeeCheyenneChickasawChileanChineseChippewaChoctawColombianColvilleComancheCosta RicanCreeCreekCroatianCrowCubanCypriotCzechCzechoslovakianDanishDelawareDominicanDutchDutch West IndianEastern EuropeanEcuadorianEgyptianEnglishEstonianEthiopianEuropeanFijianFilipinoFinnishFrenchFrench American IndianFrench CanadianGermanGerman RussianGhanaianGreekGuamanian/ChamorroGuatemalanGuyaneseHaitianHmongHonduranHopiHoumaHungarianIcelanderIndian (Asian)IndonesianInupiatIranianIraqiIrishIroquoisIsraeliItalianJamaicanJapaneseJordanianKenyanKiowaKoreanLaotianLatvianLebaneseLiberianLithuanianLumbeeLuxembourgerMacedonianMalaysianMalteseMarshalleseMenomineeMexicanMexican American IndianMongolianMoroccanNative HawaiianNavajoNepaleseNew ZealanderNicaraguanNigerianNorthern EuropeanNorwegianOkinawanOsageOttawaPaiutePakistaniPalestinianPanamanianParaguayanPennsylvania GermanPeruvianPimaPolishPortuguesePotawatomiPuebloPuerto RicanPuget Sound SalishRomanianRussianSalvadoranSamoanScandinavianScotch-IrishScottishSeminoleSenegaleseSerbianShoshoneSierra LeoneanSiouxSlavicSlovakSloveneSomaliSouth AfricanSouth AmericanSouth American IndianSoviet UnionSpaniardSpanishSpanish AmericanSpanish American IndianSri LankanSubsaharan AfricanSudaneseSwedishSwissSyrianThaiTlingit-HaidaTohono O'OdhamTonganTrinidadian and TobagonianTsimshianTurkishU.S. Virgin IslanderUgandanUkrainianUruguayanUteVenezuelanVietnameseWelshWest IndianYakamaYaquiYugoslavianYumanYup'ikZimbabwean
Immigration
NonimmigrantsImmigrantsAfghanistanAfricaAlbaniaArgentinaArmeniaAsiaAustraliaAustriaBahamasBangladeshBarbadosBelarusBelgiumBelizeBoliviaBosnia and HerzegovinaBrazilBulgariaBurma/MyanmarCabo VerdeCambodiaCameroonCanadaCaribbeanCentral AmericaChileChinaColombiaCongoCosta RicaCroatiaCubaCzechoslovakiaDenmarkDominicaDominican RepublicEastern AfricaEastern AsiaEastern EuropeEcuadorEgyptEl SalvadorEnglandEritreaEthiopiaEuropeFijiFranceGermanyGhanaGreeceGrenadaGuatemalaGuyanaHaitiHondurasHong KongHungaryIndiaIndonesiaIranIraqIrelandIsraelItalyJamaicaJapanJordanKazakhstanKenyaKoreaKuwaitLaosLatin AmericaLatviaLebanonLiberiaLithuaniaMalaysiaMexicoMicronesiaMiddle AfricaMoldovaMoroccoNepalNetherlandsNicaraguaNigeriaNorth AmericaNorth MacedoniaNorthern AfricaNorthern EuropeNorwayOceaniaPakistanPanamaPeruPhilippinesPolandPortugalRomaniaRussiaSaudi ArabiaScotlandSenegalSerbiaSierra LeoneSingaporeSomaliaSouth AfricaSouth AmericaSouth Central AsiaSouth Eastern AsiaSouthern EuropeSpainSri LankaSt. Vincent and the GrenadinesSudanSwedenSwitzerlandSyriaTaiwanThailandTrinidad and TobagoTurkeyUgandaUkraineUruguayUzbekistanVenezuelaVietnamWest IndiesWestern AfricaWestern AsiaWestern EuropeYemenZaireZimbabweAzores
Taiwanese
Race
Ancestry
AfghanAfricanAlaska NativeAlaskan AthabascanAlbanianAleutAlsatianAmericanApacheArabArapahoArgentineanArmenianAssyrian/Chaldean/SyriacAustralianAustrianBahamianBangladeshiBarbadianBasqueBelgianBelizeanBermudanBhutaneseBlackfeetBolivianBrazilianBritishBritish West IndianBulgarianBurmeseCajunCambodianCanadianCape VerdeanCarpatho RusynCelticCentral AmericanCentral American IndianCherokeeCheyenneChickasawChileanChineseChippewaChoctawColombianColvilleComancheCosta RicanCreeCreekCroatianCrowCubanCypriotCzechCzechoslovakianDanishDelawareDominicanDutchDutch West IndianEastern EuropeanEcuadorianEgyptianEnglishEstonianEthiopianEuropeanFijianFilipinoFinnishFrenchFrench American IndianFrench CanadianGermanGerman RussianGhanaianGreekGuamanian/ChamorroGuatemalanGuyaneseHaitianHmongHonduranHopiHoumaHungarianIcelanderIndian (Asian)IndonesianInupiatIranianIraqiIrishIroquoisIsraeliItalianJamaicanJapaneseJordanianKenyanKiowaKoreanLaotianLatvianLebaneseLiberianLithuanianLumbeeLuxembourgerMacedonianMalaysianMalteseMarshalleseMenomineeMexicanMexican American IndianMongolianMoroccanNative HawaiianNavajoNepaleseNew ZealanderNicaraguanNigerianNorthern EuropeanNorwegianOkinawanOsageOttawaPaiutePakistaniPalestinianPanamanianParaguayanPennsylvania GermanPeruvianPimaPolishPortuguesePotawatomiPuebloPuerto RicanPuget Sound SalishRomanianRussianSalvadoranSamoanScandinavianScotch-IrishScottishSeminoleSenegaleseSerbianShoshoneSierra LeoneanSiouxSlavicSlovakSloveneSomaliSouth AfricanSouth AmericanSouth American IndianSoviet UnionSpaniardSpanishSpanish AmericanSpanish American IndianSri LankanSubsaharan AfricanSudaneseSwedishSwissSyrianTaiwaneseThaiTlingit-HaidaTohono O'OdhamTonganTrinidadian and TobagonianTsimshianTurkishU.S. Virgin IslanderUgandanUkrainianUruguayanUteVenezuelanVietnameseWelshWest IndianYakamaYaquiYugoslavianYumanYup'ikZimbabwean
Immigration
NonimmigrantsImmigrantsAfghanistanAfricaAlbaniaArgentinaArmeniaAsiaAustraliaAustriaBahamasBangladeshBarbadosBelarusBelgiumBelizeBoliviaBosnia and HerzegovinaBrazilBulgariaBurma/MyanmarCabo VerdeCambodiaCameroonCanadaCaribbeanCentral AmericaChileChinaColombiaCongoCosta RicaCroatiaCubaCzechoslovakiaDenmarkDominicaDominican RepublicEastern AfricaEastern AsiaEastern EuropeEcuadorEgyptEl SalvadorEritreaEthiopiaEuropeFijiFranceGermanyGhanaGreeceGrenadaGuatemalaGuyanaHaitiHondurasHong KongHungaryIndiaIndonesiaIranIraqIrelandIsraelItalyJamaicaJapanJordanKazakhstanKenyaKoreaKuwaitLaosLatin AmericaLatviaLebanonLiberiaLithuaniaMalaysiaMexicoMicronesiaMiddle AfricaMoldovaMoroccoNepalNetherlandsNicaraguaNigeriaNorth AmericaNorth MacedoniaNorthern AfricaNorthern EuropeNorwayOceaniaPakistanPanamaPeruPhilippinesPolandPortugalRomaniaRussiaSaudi ArabiaScotlandSenegalSerbiaSierra LeoneSingaporeSomaliaSouth AfricaSouth AmericaSouth Central AsiaSouth Eastern AsiaSouthern EuropeSpainSri LankaSt. Vincent and the GrenadinesSudanSwedenSwitzerlandSyriaTaiwanThailandTrinidad and TobagoTurkeyUgandaUkraineUruguayUzbekistanVenezuelaVietnamWest IndiesWestern AfricaWestern AsiaWestern EuropeYemenZaireZimbabweAzores
College, 1 year or more
Income
Poverty
Unemployment
Labor Participation
Family Structure
Vehicle Availability
Education Level
Disability

College, 1 year or more Comparison

Immigrants from England

Taiwanese

Exceptional
Excellent
62.8%
COLLEGE, 1 YEAR OR MORE
98.6/ 100
METRIC RATING
84th/ 347
METRIC RANK
60.7%
COLLEGE, 1 YEAR OR MORE
84.3/ 100
METRIC RATING
138th/ 347
METRIC RANK

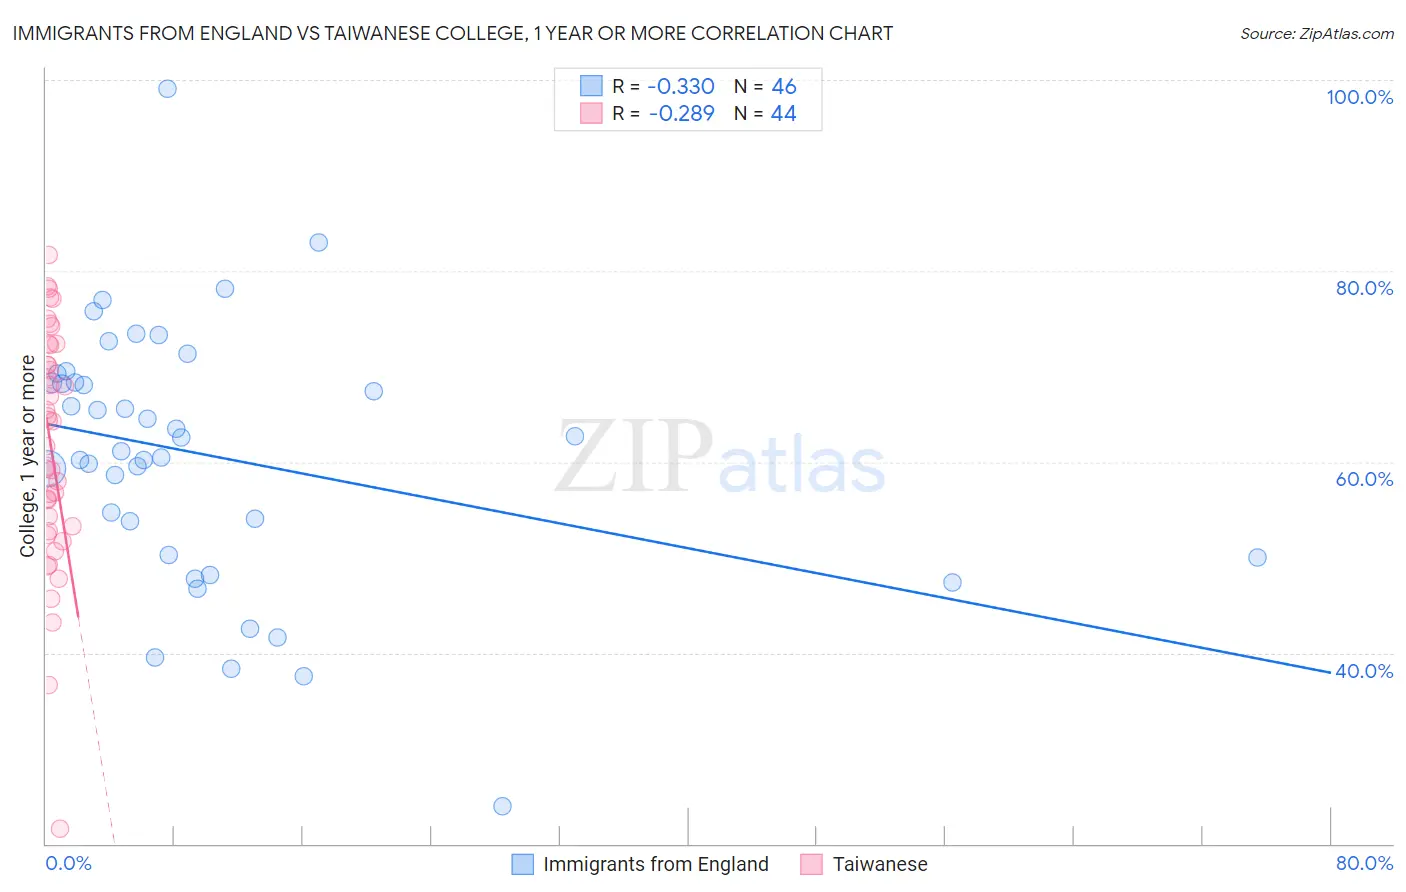
Immigrants from England vs Taiwanese College, 1 year or more Correlation Chart

The statistical analysis conducted on geographies consisting of 391,895,815 people shows a mild negative correlation between the proportion of Immigrants from England and percentage of population with at least college, 1 year or more education in the United States with a correlation coefficient (R) of -0.330 and weighted average of 62.8%. Similarly, the statistical analysis conducted on geographies consisting of 31,724,936 people shows a weak negative correlation between the proportion of Taiwanese and percentage of population with at least college, 1 year or more education in the United States with a correlation coefficient (R) of -0.289 and weighted average of 60.7%, a difference of 3.3%.
Immigrants from England vs Taiwanese College, 1 year or more

College, 1 year or more Correlation Summary

MeasurementImmigrants from EnglandTaiwanese
Minimum23.9%21.6%
Maximum99.1%81.7%
Range75.3%60.1%
Mean60.6%61.5%
Median61.9%62.9%
Interquartile 25% (IQ1)50.3%53.0%
Interquartile 75% (IQ3)68.4%71.2%
Interquartile Range (IQR)18.1%18.2%
Standard Deviation (Sample)13.7%12.5%
Standard Deviation (Population)13.6%12.3%

Similar Demographics by College, 1 year or more

Demographics Similar to Immigrants from England by College, 1 year or more

In terms of college, 1 year or more, the demographic groups most similar to Immigrants from England are Immigrants from Pakistan (62.8%, a difference of 0.010%), Immigrants from Argentina (62.8%, a difference of 0.030%), Immigrants from Western Europe (62.7%, a difference of 0.030%), Immigrants from Hungary (62.7%, a difference of 0.040%), and Immigrants from Bolivia (62.8%, a difference of 0.070%).
DemographicsRating | RankCollege, 1 year or more
Ethiopians
98.8
/100
|
#77
Exceptional
62.9%
Immigrants | Lebanon
98.8
/100
|
#78
Exceptional
62.9%
Northern Europeans
98.8
/100
|
#79
Exceptional
62.9%
Lithuanians
98.8
/100
|
#80
Exceptional
62.9%
Laotians
98.7
/100
|
#81
Exceptional
62.8%
Immigrants | Bolivia
98.7
/100
|
#82
Exceptional
62.8%
Immigrants | Argentina
98.6
/100
|
#83
Exceptional
62.8%
Immigrants | England
98.6
/100
|
#84
Exceptional
62.8%
Immigrants | Pakistan
98.6
/100
|
#85
Exceptional
62.8%
Immigrants | Western Europe
98.6
/100
|
#86
Exceptional
62.7%
Immigrants | Hungary
98.6
/100
|
#87
Exceptional
62.7%
Greeks
98.3
/100
|
#88
Exceptional
62.6%
Immigrants | Ethiopia
98.2
/100
|
#89
Exceptional
62.6%
Immigrants | Western Asia
97.9
/100
|
#90
Exceptional
62.5%
Immigrants | Eastern Europe
97.8
/100
|
#91
Exceptional
62.4%

Demographics Similar to Taiwanese by College, 1 year or more

In terms of college, 1 year or more, the demographic groups most similar to Taiwanese are Immigrants from Eritrea (60.7%, a difference of 0.0%), Iraqi (60.7%, a difference of 0.10%), Immigrants from Afghanistan (60.7%, a difference of 0.11%), Polish (60.7%, a difference of 0.15%), and Canadian (60.6%, a difference of 0.15%).
DemographicsRating | RankCollege, 1 year or more
Immigrants | Morocco
89.5
/100
|
#131
Excellent
61.1%
Scandinavians
88.2
/100
|
#132
Excellent
61.0%
Immigrants | Uzbekistan
88.0
/100
|
#133
Excellent
61.0%
Immigrants | Venezuela
87.9
/100
|
#134
Excellent
61.0%
Immigrants | Uganda
87.4
/100
|
#135
Excellent
60.9%
Basques
87.2
/100
|
#136
Excellent
60.9%
Slovenes
86.5
/100
|
#137
Excellent
60.9%
Taiwanese
84.3
/100
|
#138
Excellent
60.7%
Immigrants | Eritrea
84.3
/100
|
#139
Excellent
60.7%
Iraqis
83.3
/100
|
#140
Excellent
60.7%
Immigrants | Afghanistan
83.1
/100
|
#141
Excellent
60.7%
Poles
82.8
/100
|
#142
Excellent
60.7%
Canadians
82.7
/100
|
#143
Excellent
60.6%
Czechs
81.9
/100
|
#144
Excellent
60.6%
Slavs
81.1
/100
|
#145
Excellent
60.6%